

The Poisson model is the simplest null hypothesis against
which we can compare other models. However, its timeindependence in which earthquakes are implicitly random
events is not appealing, because almost all of our seismological
instincts favor earthquake cycle models, in which strain builds
up slowly from one major earthquake to the next. 5 In this case,
the probability of a large earthquake should be small immediately after a large earthquake, and then grow with time. This is
described by time-dependent models in which the probability
of a large earthquake a time t after the past one is given by a
probability density distribution p(t, τ, σ) that depends on the
average and variability of the recurrence times, described by
the mean τ and the standard deviation σ. In other words, p
gives the probability that the recurrence time for this earthquake will be t, given an assumed distribution of recurrence
times. The cumulative probability that the earthquake will
occur by time T since the past earthquake is found by integrating the density function
P T
p t
dt
T
( )
( , , ) .
=
Ύ
0
τ σ
(10)
We seek to estimate how likely an earthquake is between
now and some future time. Formally, this is the conditional
probability that the earthquake will occur between time T 0
(now) and a future time T, given the condition that it has not
yet happened by time T 0 . To do this, we use Bayes’s theorem,
which states that P(A|B), the conditional probability of event
A given that event B has occurred, is the ratio of the joint
probability P(A, B) of both A and B to P(B), the probability of
event B:
P(A|B) = P(A, B)/P(B).
(11)
In this case, the conditional probability C(T, T 0 ) that the earthquake will occur between T 0 and T is the ratio of the probability that it will occur in that interval to the probability that it has
not yet happened by T 0 , which is just 1 minus the probability
that it has. Hence
C(T, T 0 ) = (P(T) − P(T 0 ))/(1 − P(T 0 )).
(12)
The denominator is less than one, so the conditional probability is greater than the joint probability (numerator) because
the fact that the earthquake has not happened makes it more
likely.
This approach can be used with any assumed probability
density function. The simplest is to assume that earthquake
recurrence follows the familiar Gaussian or normal (bell curve)
distribution (Section 6.5.1)
5 Of course, these instincts favoring determinism may ultimately prove incorrect —
Einstein initially rejected quantum mechanics, arguing that “God does not play dice.”
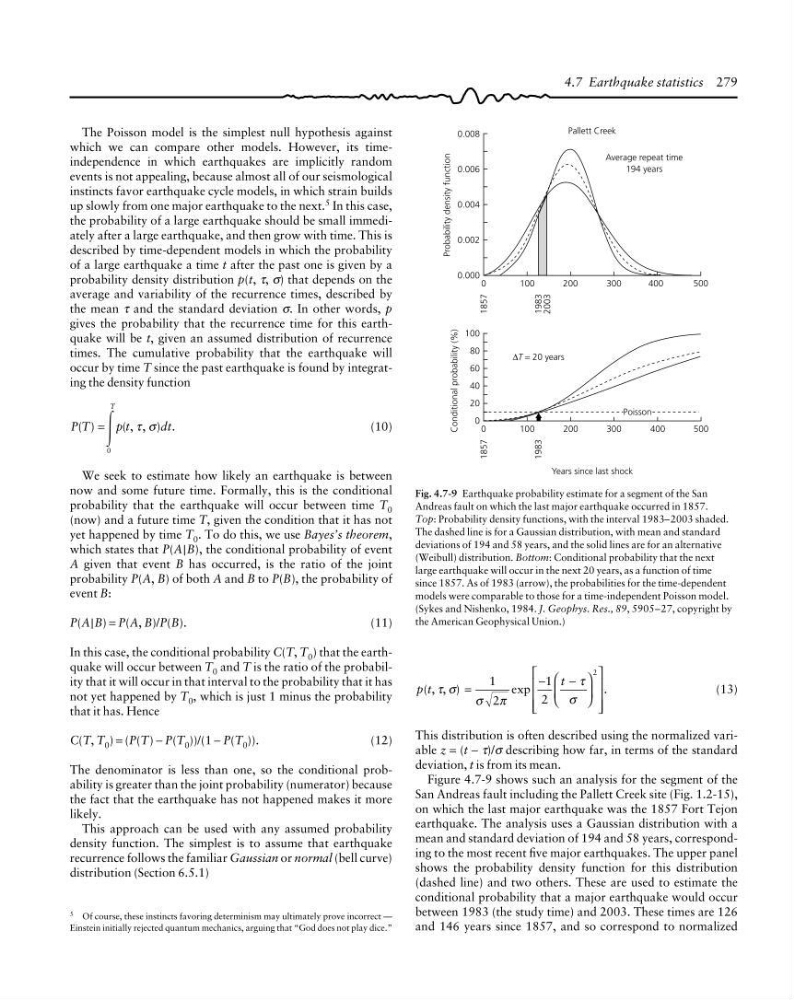
Fig. 4.7-9 Earthquake probability estimate for a segment of the San
Andreas fault on which the last major earthquake occurred in 1857.
Top: Probability density functions, with the interval 1983–2003 shaded.
The dashed line is for a Gaussian distribution, with mean and standard
deviations of 194 and 58 years, and the solid lines are for an alternative
(Weibull) distribution. Bottom: Conditional probability that the next
large earthquake will occur in the next 20 years, as a function of time
since 1857. As of 1983 (arrow), the probabilities for the time-dependent
models were comparable to those for a time-independent Poisson model.
(Sykes and Nishenko, 1984. J. Geophys. Res., 89, 5905–27, copyright by
the American Geophysical Union.)
Probability density function
0.008
0.006
0.004
0.002
0.000
500
0
100
200
300
400
Pallett Creek
Average repeat time
194 years
1857
1983
2003
Conditional probability (%)
100
80
60
40
20
0
0
100
200
300
400
500
∆T = 20 years
Poisson
1857
1983
Years since last shock
4.7 Earthquake statistics 279
p(t, τ, σ) =
−
−
⎛
⎝
⎜
⎞
⎠
⎟
⎡
⎣
⎢
⎢
⎢
⎤
⎦
⎥
⎥
⎥
exp
.
1
2
1
2
2
σ π
τ
σ
t
(13)
This distribution is often described using the normalized variable z = (t − τ)/σ describing how far, in terms of the standard
deviation, t is from its mean.
Figure 4.7-9 shows such an analysis for the segment of the
San Andreas fault including the Pallett Creek site (Fig. 1.2-15),
on which the last major earthquake was the 1857 Fort Tejon
earthquake. The analysis uses a Gaussian distribution with a
mean and standard deviation of 194 and 58 years, corresponding to the most recent five major earthquakes. The upper panel
shows the probability density function for this distribution
(dashed line) and two others. These are used to estimate the
conditional probability that a major earthquake would occur
between 1983 (the study time) and 2003. These times are 126
and 146 years since 1857, and so correspond to normalized
which we can compare other models. However, its timeindependence in which earthquakes are implicitly random
events is not appealing, because almost all of our seismological
instincts favor earthquake cycle models, in which strain builds
up slowly from one major earthquake to the next. 5 In this case,
the probability of a large earthquake should be small immediately after a large earthquake, and then grow with time. This is
described by time-dependent models in which the probability
of a large earthquake a time t after the past one is given by a
probability density distribution p(t, τ, σ) that depends on the
average and variability of the recurrence times, described by
the mean τ and the standard deviation σ. In other words, p
gives the probability that the recurrence time for this earthquake will be t, given an assumed distribution of recurrence
times. The cumulative probability that the earthquake will
occur by time T since the past earthquake is found by integrating the density function
P T
p t
dt
T
( )
( , , ) .
=
Ύ
0
τ σ
(10)
We seek to estimate how likely an earthquake is between
now and some future time. Formally, this is the conditional
probability that the earthquake will occur between time T 0
(now) and a future time T, given the condition that it has not
yet happened by time T 0 . To do this, we use Bayes’s theorem,
which states that P(A|B), the conditional probability of event
A given that event B has occurred, is the ratio of the joint
probability P(A, B) of both A and B to P(B), the probability of
event B:
P(A|B) = P(A, B)/P(B).
(11)
In this case, the conditional probability C(T, T 0 ) that the earthquake will occur between T 0 and T is the ratio of the probability that it will occur in that interval to the probability that it has
not yet happened by T 0 , which is just 1 minus the probability
that it has. Hence
C(T, T 0 ) = (P(T) − P(T 0 ))/(1 − P(T 0 )).
(12)
The denominator is less than one, so the conditional probability is greater than the joint probability (numerator) because
the fact that the earthquake has not happened makes it more
likely.
This approach can be used with any assumed probability
density function. The simplest is to assume that earthquake
recurrence follows the familiar Gaussian or normal (bell curve)
distribution (Section 6.5.1)
5 Of course, these instincts favoring determinism may ultimately prove incorrect —
Einstein initially rejected quantum mechanics, arguing that “God does not play dice.”
Fig. 4.7-9 Earthquake probability estimate for a segment of the San
Andreas fault on which the last major earthquake occurred in 1857.
Top: Probability density functions, with the interval 1983–2003 shaded.
The dashed line is for a Gaussian distribution, with mean and standard
deviations of 194 and 58 years, and the solid lines are for an alternative
(Weibull) distribution. Bottom: Conditional probability that the next
large earthquake will occur in the next 20 years, as a function of time
since 1857. As of 1983 (arrow), the probabilities for the time-dependent
models were comparable to those for a time-independent Poisson model.
(Sykes and Nishenko, 1984. J. Geophys. Res., 89, 5905–27, copyright by
the American Geophysical Union.)
Probability density function
0.008
0.006
0.004
0.002
0.000
500
0
100
200
300
400
Pallett Creek
Average repeat time
194 years
1857
1983
2003
Conditional probability (%)
100
80
60
40
20
0
0
100
200
300
400
500
∆T = 20 years
Poisson
1857
1983
Years since last shock
4.7 Earthquake statistics 279
p(t, τ, σ) =
−
−
⎛
⎝
⎜
⎞
⎠
⎟
⎡
⎣
⎢
⎢
⎢
⎤
⎦
⎥
⎥
⎥
exp
.
1
2
1
2
2
σ π
τ
σ
t
(13)
This distribution is often described using the normalized variable z = (t − τ)/σ describing how far, in terms of the standard
deviation, t is from its mean.
Figure 4.7-9 shows such an analysis for the segment of the
San Andreas fault including the Pallett Creek site (Fig. 1.2-15),
on which the last major earthquake was the 1857 Fort Tejon
earthquake. The analysis uses a Gaussian distribution with a
mean and standard deviation of 194 and 58 years, corresponding to the most recent five major earthquakes. The upper panel
shows the probability density function for this distribution
(dashed line) and two others. These are used to estimate the
conditional probability that a major earthquake would occur
between 1983 (the study time) and 2003. These times are 126
and 146 years since 1857, and so correspond to normalized