

272 Earthquakes
Log amplitude (dyn-cm)
27
26
25
24
23
22
−3
−2
−1
0
1
Log frequency (Hz)
M 0
M s
m b
v R (km/s)
10
100
∆ (bars)
σ
Source spectrum
1
3
M
s
8
7
6
5
m b
transform
ridge
intraplate
5
6
7
M
w
7
6
5
M s
transform
ridge
intraplate
5
6
7
transform
ridge
intraplate
M
w
7
6
5
transform
ridge
intraplate
M
w
7
6
5
0
5
10
15
20 s
, source time function duration (s)
τ
0.001
0.01
0.1
1
10
M 0 /
3 (10
24 dyn-cm/s
3 )
τ
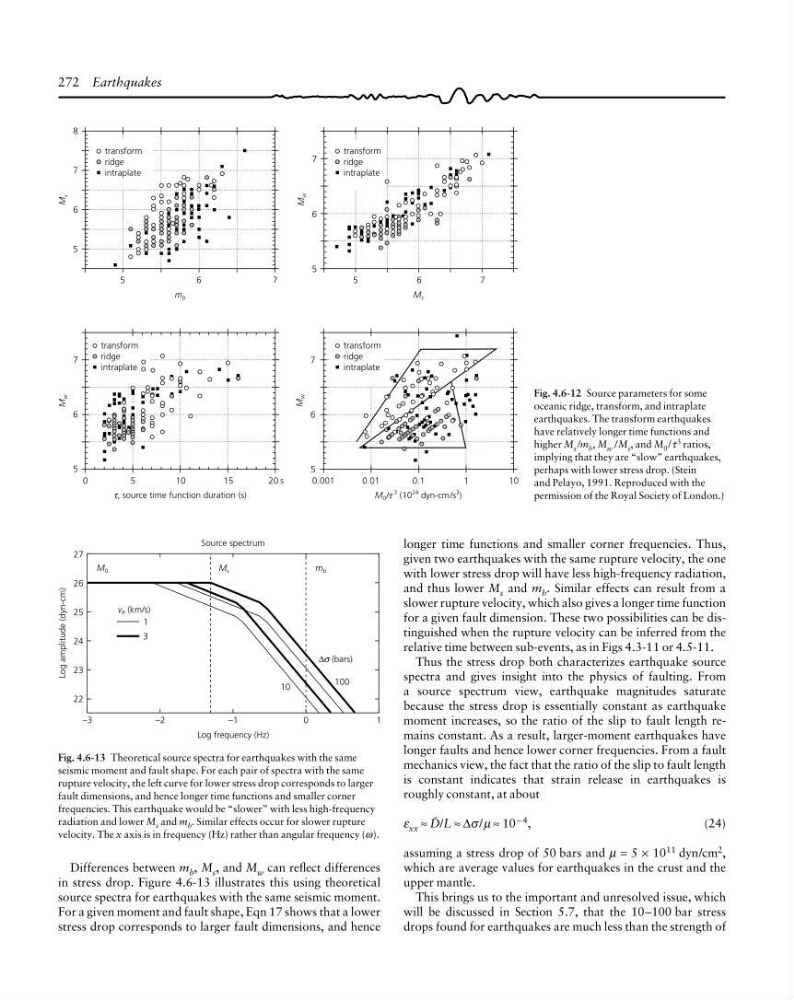
Fig. 4.6-13 Theoretical source spectra for earthquakes with the same
seismic moment and fault shape. For each pair of spectra with the same
rupture velocity, the left curve for lower stress drop corresponds to larger
fault dimensions, and hence longer time functions and smaller corner
frequencies. This earthquake would be “slower” with less high-frequency
radiation and lower M s and m b . Similar effects occur for slower rupture
velocity. The x axis is in frequency (Hz) rather than angular frequency (ω).
Differences between m b , M s , and M w can reflect differences
in stress drop. Figure 4.6-13 illustrates this using theoretical
source spectra for earthquakes with the same seismic moment.
For a given moment and fault shape, Eqn 17 shows that a lower
stress drop corresponds to larger fault dimensions, and hence
longer time functions and smaller corner frequencies. Thus,
given two earthquakes with the same rupture velocity, the one
with lower stress drop will have less high-frequency radiation,
and thus lower M s and m b . Similar effects can result from a
slower rupture velocity, which also gives a longer time function
for a given fault dimension. These two possibilities can be distinguished when the rupture velocity can be inferred from the
relative time between sub-events, as in Figs 4.3-11 or 4.5-11.
Thus the stress drop both characterizes earthquake source
spectra and gives insight into the physics of faulting. From
a source spectrum view, earthquake magnitudes saturate
because the stress drop is essentially constant as earthquake
moment increases, so the ratio of the slip to fault length remains constant. As a result, larger-moment earthquakes have
longer faults and hence lower corner frequencies. From a fault
mechanics view, the fact that the ratio of the slip to fault length
is constant indicates that strain release in earthquakes is
roughly constant, at about
ε xx ≈ C/L ≈ ∆σ /µ ≈ 10 − 4 ,
(24)
assuming a stress drop of 50 bars and µ = 5 × 10
11 dyn/cm
2
,
which are average values for earthquakes in the crust and the
upper mantle.
This brings us to the important and unresolved issue, which
will be discussed in Section 5.7, that the 10–100 bar stress
drops found for earthquakes are much less than the strength of
Fig. 4.6-12 Source parameters for some
oceanic ridge, transform, and intraplate
earthquakes. The transform earthquakes
have relatively longer time functions and
higher M s /m b , M w /M s , and M 0 /τ
3 ratios,
implying that they are “slow” earthquakes,
perhaps with lower stress drop. (Stein
and Pelayo, 1991. Reproduced with the
permission of the Royal Society of London.)
Log amplitude (dyn-cm)
27
26
25
24
23
22
−3
−2
−1
0
1
Log frequency (Hz)
M 0
M s
m b
v R (km/s)
10
100
∆ (bars)
σ
Source spectrum
1
3
M
s
8
7
6
5
m b
transform
ridge
intraplate
5
6
7
M
w
7
6
5
M s
transform
ridge
intraplate
5
6
7
transform
ridge
intraplate
M
w
7
6
5
transform
ridge
intraplate
M
w
7
6
5
0
5
10
15
20 s
, source time function duration (s)
τ
0.001
0.01
0.1
1
10
M 0 /
3 (10
24 dyn-cm/s
3 )
τ
Fig. 4.6-13 Theoretical source spectra for earthquakes with the same
seismic moment and fault shape. For each pair of spectra with the same
rupture velocity, the left curve for lower stress drop corresponds to larger
fault dimensions, and hence longer time functions and smaller corner
frequencies. This earthquake would be “slower” with less high-frequency
radiation and lower M s and m b . Similar effects occur for slower rupture
velocity. The x axis is in frequency (Hz) rather than angular frequency (ω).
Differences between m b , M s , and M w can reflect differences
in stress drop. Figure 4.6-13 illustrates this using theoretical
source spectra for earthquakes with the same seismic moment.
For a given moment and fault shape, Eqn 17 shows that a lower
stress drop corresponds to larger fault dimensions, and hence
longer time functions and smaller corner frequencies. Thus,
given two earthquakes with the same rupture velocity, the one
with lower stress drop will have less high-frequency radiation,
and thus lower M s and m b . Similar effects can result from a
slower rupture velocity, which also gives a longer time function
for a given fault dimension. These two possibilities can be distinguished when the rupture velocity can be inferred from the
relative time between sub-events, as in Figs 4.3-11 or 4.5-11.
Thus the stress drop both characterizes earthquake source
spectra and gives insight into the physics of faulting. From
a source spectrum view, earthquake magnitudes saturate
because the stress drop is essentially constant as earthquake
moment increases, so the ratio of the slip to fault length remains constant. As a result, larger-moment earthquakes have
longer faults and hence lower corner frequencies. From a fault
mechanics view, the fact that the ratio of the slip to fault length
is constant indicates that strain release in earthquakes is
roughly constant, at about
ε xx ≈ C/L ≈ ∆σ /µ ≈ 10 − 4 ,
(24)
assuming a stress drop of 50 bars and µ = 5 × 10
11 dyn/cm
2
,
which are average values for earthquakes in the crust and the
upper mantle.
This brings us to the important and unresolved issue, which
will be discussed in Section 5.7, that the 10–100 bar stress
drops found for earthquakes are much less than the strength of
Fig. 4.6-12 Source parameters for some
oceanic ridge, transform, and intraplate
earthquakes. The transform earthquakes
have relatively longer time functions and
higher M s /m b , M w /M s , and M 0 /τ
3 ratios,
implying that they are “slow” earthquakes,
perhaps with lower stress drop. (Stein
and Pelayo, 1991. Reproduced with the
permission of the Royal Society of London.)