

Because the radar wavelengths are 10s of centimeters, a radar
antenna a few meters long orbiting hundreds of kilometers
above the earth can normally resolve topography only on a
scale of kilometers. However, SAR uses signal processing to
combine information collected by a moving satellite to simulate an antenna much larger than the satellite’s real antenna.
For example, a real 10 m antenna can be used as a 4 km
synthetic antenna. The synthetic antenna can thus resolve both
topography and crustal deformation on a “footprint” of tens
of meters.
Figure 4.5-2 (right) illustrates the technique. The phase
difference between radar signals with wavelength λ reflected
from the earth’s surface and recorded by antennas at position
A 1 and A 2 is
φ = (4π/λ)(r 2 − r 1 ),
(2)
where r i is the range from the antenna at A i to the reflection
point. The antenna baseline separation vector B and satellite
flight height H are known from the satellite orbits. Because
the baseline length | B | is much shorter than the ranges r i , an
analysis like that used to derive the earthquake rupture time
(Fig. 4.3-2) shows that the elevation of the reflecting point is
h = H − r 1 cos θ, so topography can be mapped from space.
This method, called interferometry, 4 is used for both earth and
planetary mapping, such as the Magellan mission to Venus.
Two such radar images can detect ground motion between
successive measurements. If differences in satellite positions
between the measurements are removed, a vector surface
displacement D causes a phase change
φ ≈ (4π/λ)δr, δr = (D · 5),
(3)
where δ r is the projection (scalar product, Section A.3.3) of
the vector displacement along 5, the look direction connecting
the satellite and reflection point. To find the full displacement vector, observations from ascending (moving north) and
descending (moving south) tracks of the satellite, or different
satellites, can be combined.
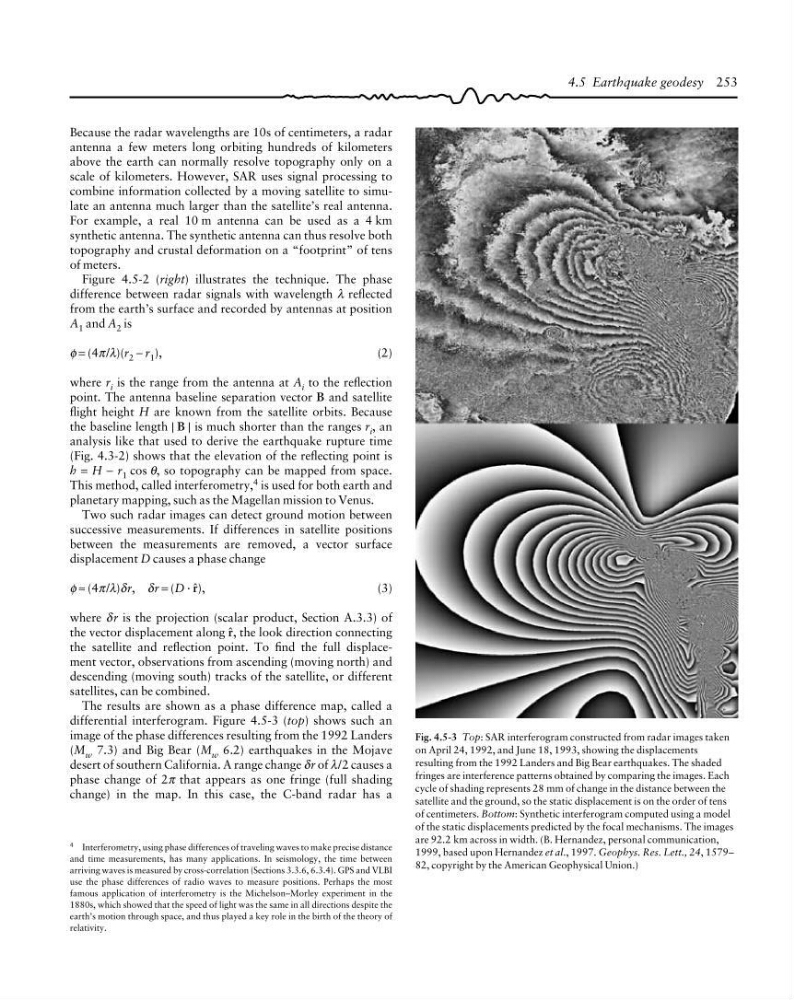
The results are shown as a phase difference map, called a
differential interferogram. Figure 4.5-3 (top) shows such an
image of the phase differences resulting from the 1992 Landers
(M w 7.3) and Big Bear (M w 6.2) earthquakes in the Mojave
desert of southern California. A range change δr of λ/2 causes a
phase change of 2π that appears as one fringe (full shading
change) in the map. In this case, the C-band radar has a
4.5 Earthquake geodesy 253
4 Interferometry, using phase differences of traveling waves to make precise distance
and time measurements, has many applications. In seismology, the time between
arriving waves is measured by cross-correlation (Sections 3.3.6, 6.3.4). GPS and VLBI
use the phase differences of radio waves to measure positions. Perhaps the most
famous application of interferometry is the Michelson–Morley experiment in the
1880s, which showed that the speed of light was the same in all directions despite the
earth’s motion through space, and thus played a key role in the birth of the theory of
relativity.
Fig. 4.5-3 Top: SAR interferogram constructed from radar images taken
on April 24, 1992, and June 18, 1993, showing the displacements
resulting from the 1992 Landers and Big Bear earthquakes. The shaded
fringes are interference patterns obtained by comparing the images. Each
cycle of shading represents 28 mm of change in the distance between the
satellite and the ground, so the static displacement is on the order of tens
of centimeters. Bottom: Synthetic interferogram computed using a model
of the static displacements predicted by the focal mechanisms. The images
are 92.2 km across in width. (B. Hernandez, personal communication,
1999, based upon Hernandez et al., 1997. Geophys. Res. Lett., 24, 1579–
82, copyright by the American Geophysical Union.)
antenna a few meters long orbiting hundreds of kilometers
above the earth can normally resolve topography only on a
scale of kilometers. However, SAR uses signal processing to
combine information collected by a moving satellite to simulate an antenna much larger than the satellite’s real antenna.
For example, a real 10 m antenna can be used as a 4 km
synthetic antenna. The synthetic antenna can thus resolve both
topography and crustal deformation on a “footprint” of tens
of meters.
Figure 4.5-2 (right) illustrates the technique. The phase
difference between radar signals with wavelength λ reflected
from the earth’s surface and recorded by antennas at position
A 1 and A 2 is
φ = (4π/λ)(r 2 − r 1 ),
(2)
where r i is the range from the antenna at A i to the reflection
point. The antenna baseline separation vector B and satellite
flight height H are known from the satellite orbits. Because
the baseline length | B | is much shorter than the ranges r i , an
analysis like that used to derive the earthquake rupture time
(Fig. 4.3-2) shows that the elevation of the reflecting point is
h = H − r 1 cos θ, so topography can be mapped from space.
This method, called interferometry, 4 is used for both earth and
planetary mapping, such as the Magellan mission to Venus.
Two such radar images can detect ground motion between
successive measurements. If differences in satellite positions
between the measurements are removed, a vector surface
displacement D causes a phase change
φ ≈ (4π/λ)δr, δr = (D · 5),
(3)
where δ r is the projection (scalar product, Section A.3.3) of
the vector displacement along 5, the look direction connecting
the satellite and reflection point. To find the full displacement vector, observations from ascending (moving north) and
descending (moving south) tracks of the satellite, or different
satellites, can be combined.
The results are shown as a phase difference map, called a
differential interferogram. Figure 4.5-3 (top) shows such an
image of the phase differences resulting from the 1992 Landers
(M w 7.3) and Big Bear (M w 6.2) earthquakes in the Mojave
desert of southern California. A range change δr of λ/2 causes a
phase change of 2π that appears as one fringe (full shading
change) in the map. In this case, the C-band radar has a
4.5 Earthquake geodesy 253
4 Interferometry, using phase differences of traveling waves to make precise distance
and time measurements, has many applications. In seismology, the time between
arriving waves is measured by cross-correlation (Sections 3.3.6, 6.3.4). GPS and VLBI
use the phase differences of radio waves to measure positions. Perhaps the most
famous application of interferometry is the Michelson–Morley experiment in the
1880s, which showed that the speed of light was the same in all directions despite the
earth’s motion through space, and thus played a key role in the birth of the theory of
relativity.
Fig. 4.5-3 Top: SAR interferogram constructed from radar images taken
on April 24, 1992, and June 18, 1993, showing the displacements
resulting from the 1992 Landers and Big Bear earthquakes. The shaded
fringes are interference patterns obtained by comparing the images. Each
cycle of shading represents 28 mm of change in the distance between the
satellite and the ground, so the static displacement is on the order of tens
of centimeters. Bottom: Synthetic interferogram computed using a model
of the static displacements predicted by the focal mechanisms. The images
are 92.2 km across in width. (B. Hernandez, personal communication,
1999, based upon Hernandez et al., 1997. Geophys. Res. Lett., 24, 1579–
82, copyright by the American Geophysical Union.)