

216 Earthquakes
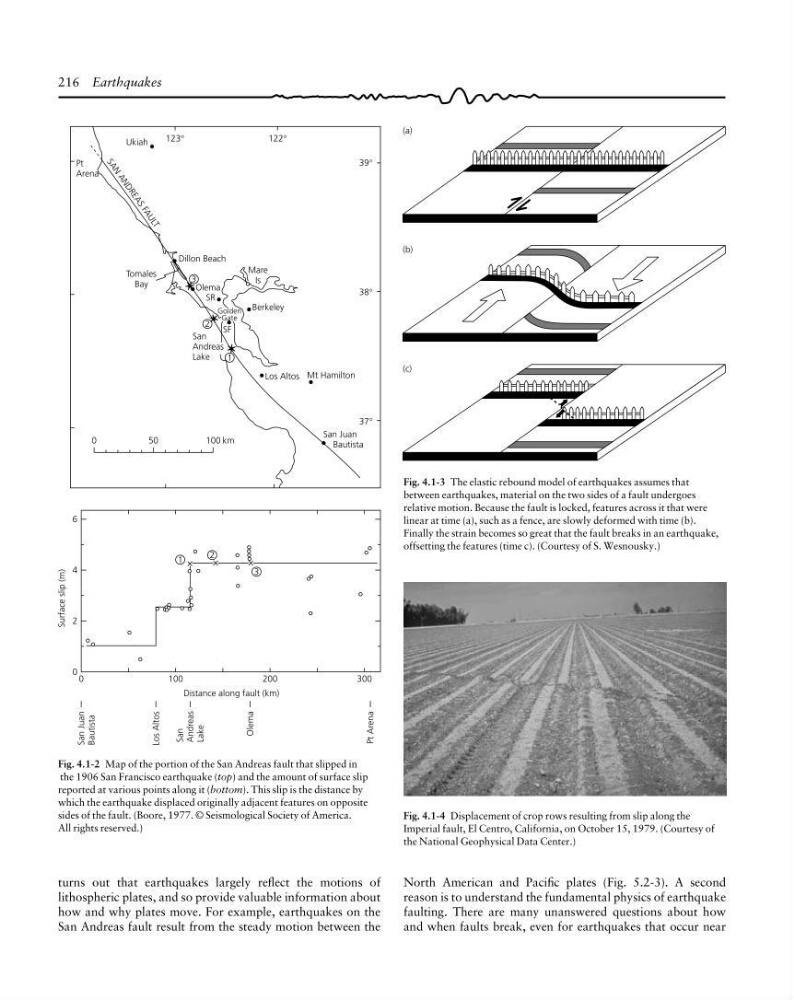
Fig. 4.1-2 Map of the portion of the San Andreas fault that slipped in
the 1906 San Francisco earthquake (top) and the amount of surface slip
reported at various points along it (bottom). This slip is the distance by
which the earthquake displaced originally adjacent features on opposite
sides of the fault. (Boore, 1977. © Seismological Society of America.
All rights reserved.)
Fig. 4.1-3 The elastic rebound model of earthquakes assumes that
between earthquakes, material on the two sides of a fault undergoes
relative motion. Because the fault is locked, features across it that were
linear at time (a), such as a fence, are slowly deformed with time (b).
Finally the strain becomes so great that the fault breaks in an earthquake,
offsetting the features (time c). (Courtesy of S. Wesnousky.)
Fig. 4.1-4 Displacement of crop rows resulting from slip along the
Imperial fault, El Centro, California, on October 15, 1979. (Courtesy of
the National Geophysical Data Center.)
turns out that earthquakes largely reflect the motions of
lithospheric plates, and so provide valuable information about
how and why plates move. For example, earthquakes on the
San Andreas fault result from the steady motion between the
North American and Pacific plates (Fig. 5.2-3). A second
reason is to understand the fundamental physics of earthquake
faulting. There are many unanswered questions about how
and when faults break, even for earthquakes that occur near
Surface slip (m)
6
4
2
0
0
100
200
300
Distance along fault (km)
1
2
3
San Juan
Bautista
Los Altos
San
Andreas
Lake
Olema
Pt Arena
0
50
100 km
123°
122°
39°
38°
37°
Ukiah
Pt
Arena
1
2
San Juan
Bautista
Los Altos Mt Hamilton
San
Andreas
Lake
Golden
Gate
SF
Berkeley
Olema
SR
Dillon Beach
Mare
Is
Tomales
Bay
S
A
N
A
N
D
R
E
A
S
F
A
U
L
T
3
(a)
(b)
(c)
Fig. 4.1-2 Map of the portion of the San Andreas fault that slipped in
the 1906 San Francisco earthquake (top) and the amount of surface slip
reported at various points along it (bottom). This slip is the distance by
which the earthquake displaced originally adjacent features on opposite
sides of the fault. (Boore, 1977. © Seismological Society of America.
All rights reserved.)
Fig. 4.1-3 The elastic rebound model of earthquakes assumes that
between earthquakes, material on the two sides of a fault undergoes
relative motion. Because the fault is locked, features across it that were
linear at time (a), such as a fence, are slowly deformed with time (b).
Finally the strain becomes so great that the fault breaks in an earthquake,
offsetting the features (time c). (Courtesy of S. Wesnousky.)
Fig. 4.1-4 Displacement of crop rows resulting from slip along the
Imperial fault, El Centro, California, on October 15, 1979. (Courtesy of
the National Geophysical Data Center.)
turns out that earthquakes largely reflect the motions of
lithospheric plates, and so provide valuable information about
how and why plates move. For example, earthquakes on the
San Andreas fault result from the steady motion between the
North American and Pacific plates (Fig. 5.2-3). A second
reason is to understand the fundamental physics of earthquake
faulting. There are many unanswered questions about how
and when faults break, even for earthquakes that occur near
Surface slip (m)
6
4
2
0
0
100
200
300
Distance along fault (km)
1
2
3
San Juan
Bautista
Los Altos
San
Andreas
Lake
Olema
Pt Arena
0
50
100 km
123°
122°
39°
38°
37°
Ukiah
Pt
Arena
1
2
San Juan
Bautista
Los Altos Mt Hamilton
San
Andreas
Lake
Golden
Gate
SF
Berkeley
Olema
SR
Dillon Beach
Mare
Is
Tomales
Bay
S
A
N
A
N
D
R
E
A
S
F
A
U
L
T
3
(a)
(b)
(c)