

214 Seismology and Earth Structure
C-2. Write a program to generate and plot travel times for reflections
from a series of flat interfaces using both the expressions for
travel time and distance (Eqns 3.3.7, 3.3.8) and their hyperbolic
approximation (Eqn 3.3.11). Calculate the travel times for the
oceanic crust model given in Fig. 3.2-15. Compare the results
from the two methods.
C-3. (a) Write a subroutine to calculate the cross-correlation of two
time series sampled at discrete times.
(b) Write a subroutine to calculate a Vibroseis sweep signal
(Eqn 3.3.57) of a given length, T, and frequency range (f 1 , f 2 ).
The start time, t 0 , and sample rate, ∆t, should also be
parameters.
(c) Generate and plot a sweep for ∆t = 0.0025 s, t 0 = 0, T = 5 s,
f 1 = 7 Hz, and f 2 = 14 Hz. Use the results of part (a) to find
and plot its auto-correlation.
C-4. (a) Write a subroutine to generate a reflector series (Eqn 3.3.61)
for a series of layers with thicknesses h i , velocities v i , and
densities ρ i .
(b) Calculate and plot the results for two layers over a halfspace, if the first layer is 3 km thick, with v = 2.5 km /s and
ρ = 2.1 g/cm
3 , the second is 4 km thick with v = 3.2 km/s
and ρ = 2.4 g/cm
3 , and the halfspace has v = 4.5 km/s and
ρ = 2.8 g/cm
3 .
(c) Calculate and plot the vertical incidence synthetic seismogram for this structure and the source given in the previous
problem.
(d) Using the results of problem C-3, cross-correlate the
seismogram with the sweep and plot the resulting time
series.
(e) Repeat parts (b)–(d), cutting the second layer thickness in half
each time. When can you no longer resolve the second layer
on the time series after cross-correlation?
C-5. (a) Write a program which takes a source at any depth and traces
rays, selected by a range of incidence angles at the source,
through an earth model. Have the graphic output show the
source, ray paths, earth’s surface, core–mantle boundary, and
inner core–outer core boundary.
(b) Using PREM or another earth model, trace rays for sources at
the surface and at 300 km depth. Have the ray paths show the
effects of upper mantle discontinuities and the core.
(c) Have the program produce a travel time plot. Can you resolve
the upper mantle discontinuities in this plot?
C-6. (a) Write a program that computes the mass, M, moment of
inertia about the polar axis, C, and C/Ma
2 ratio for a planet
of radius a. To do this, treat the planet as a series of n shells
whose densities you input.
(b) Determine models for the densities of
a
M
C/Ma
2
earth
6371 km
5.977 × 10
24 kg
0.331
moon
1738 km
7.352 × 10
22 kg
0.395
Mars
3390 km
6.419 × 10
23 kg
0.365
that satisfy the observed M and C/Ma 2 . Can you satisfy the
data for Mars and the earth without a dense core?
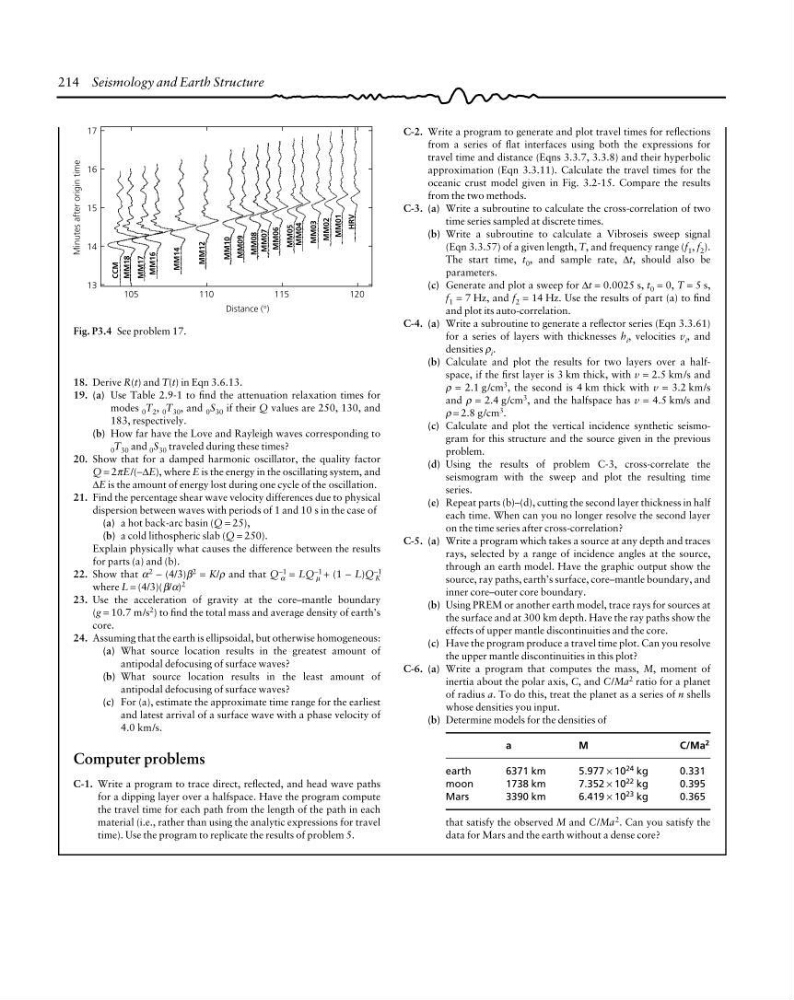
Fig. P3.4 See problem 17.
Minutes after origin time
17
16
15
14
13
CCM
MM18
MM17
105
110
115
120
Distance (°)
MM16
MM14
MM12
MM10
MM09
MM08
MM07
MM06
MM05
MM04
MM03
MM02
MM01
HRV
18. Derive R(t) and T(t) in Eqn 3.6.13.
19. (a) Use Table 2.9-1 to find the attenuation relaxation times for
modes 0 T 2 , 0 T 30 , and 0 S 30 if their Q values are 250, 130, and
183, respectively.
(b) How far have the Love and Rayleigh waves corresponding to
0 T 30 and 0 S 30 traveled during these times?
20. Show that for a damped harmonic oscillator, the quality factor
Q = 2πE/(−∆E), where E is the energy in the oscillating system, and
∆E is the amount of energy lost during one cycle of the oscillation.
21. Find the percentage shear wave velocity differences due to physical
dispersion between waves with periods of 1 and 10 s in the case of
(a) a hot back-arc basin (Q = 25),
(b) a cold lithospheric slab (Q = 250).
Explain physically what causes the difference between the results
for parts (a) and (b).
22. Show that α
2 − (4/3)β
2 = K/ρ and that Q
−1
α = LQ
−1
µ + (1 − L)Q
−1
K
where L = (4/3)(β/α) 2
23. Use the acceleration of gravity at the core–mantle boundary
(g = 10.7 m/s
2 ) to find the total mass and average density of earth’s
core.
24. Assuming that the earth is ellipsoidal, but otherwise homogeneous:
(a) What source location results in the greatest amount of
antipodal defocusing of surface waves?
(b) What source location results in the least amount of
antipodal defocusing of surface waves?
(c) For (a), estimate the approximate time range for the earliest
and latest arrival of a surface wave with a phase velocity of
4.0 km/s.
Computer problems
C-1. Write a program to trace direct, reflected, and head wave paths
for a dipping layer over a halfspace. Have the program compute
the travel time for each path from the length of the path in each
material (i.e., rather than using the analytic expressions for travel
time). Use the program to replicate the results of problem 5.
C-2. Write a program to generate and plot travel times for reflections
from a series of flat interfaces using both the expressions for
travel time and distance (Eqns 3.3.7, 3.3.8) and their hyperbolic
approximation (Eqn 3.3.11). Calculate the travel times for the
oceanic crust model given in Fig. 3.2-15. Compare the results
from the two methods.
C-3. (a) Write a subroutine to calculate the cross-correlation of two
time series sampled at discrete times.
(b) Write a subroutine to calculate a Vibroseis sweep signal
(Eqn 3.3.57) of a given length, T, and frequency range (f 1 , f 2 ).
The start time, t 0 , and sample rate, ∆t, should also be
parameters.
(c) Generate and plot a sweep for ∆t = 0.0025 s, t 0 = 0, T = 5 s,
f 1 = 7 Hz, and f 2 = 14 Hz. Use the results of part (a) to find
and plot its auto-correlation.
C-4. (a) Write a subroutine to generate a reflector series (Eqn 3.3.61)
for a series of layers with thicknesses h i , velocities v i , and
densities ρ i .
(b) Calculate and plot the results for two layers over a halfspace, if the first layer is 3 km thick, with v = 2.5 km /s and
ρ = 2.1 g/cm
3 , the second is 4 km thick with v = 3.2 km/s
and ρ = 2.4 g/cm
3 , and the halfspace has v = 4.5 km/s and
ρ = 2.8 g/cm
3 .
(c) Calculate and plot the vertical incidence synthetic seismogram for this structure and the source given in the previous
problem.
(d) Using the results of problem C-3, cross-correlate the
seismogram with the sweep and plot the resulting time
series.
(e) Repeat parts (b)–(d), cutting the second layer thickness in half
each time. When can you no longer resolve the second layer
on the time series after cross-correlation?
C-5. (a) Write a program which takes a source at any depth and traces
rays, selected by a range of incidence angles at the source,
through an earth model. Have the graphic output show the
source, ray paths, earth’s surface, core–mantle boundary, and
inner core–outer core boundary.
(b) Using PREM or another earth model, trace rays for sources at
the surface and at 300 km depth. Have the ray paths show the
effects of upper mantle discontinuities and the core.
(c) Have the program produce a travel time plot. Can you resolve
the upper mantle discontinuities in this plot?
C-6. (a) Write a program that computes the mass, M, moment of
inertia about the polar axis, C, and C/Ma
2 ratio for a planet
of radius a. To do this, treat the planet as a series of n shells
whose densities you input.
(b) Determine models for the densities of
a
M
C/Ma
2
earth
6371 km
5.977 × 10
24 kg
0.331
moon
1738 km
7.352 × 10
22 kg
0.395
Mars
3390 km
6.419 × 10
23 kg
0.365
that satisfy the observed M and C/Ma 2 . Can you satisfy the
data for Mars and the earth without a dense core?
Fig. P3.4 See problem 17.
Minutes after origin time
17
16
15
14
13
CCM
MM18
MM17
105
110
115
120
Distance (°)
MM16
MM14
MM12
MM10
MM09
MM08
MM07
MM06
MM05
MM04
MM03
MM02
MM01
HRV
18. Derive R(t) and T(t) in Eqn 3.6.13.
19. (a) Use Table 2.9-1 to find the attenuation relaxation times for
modes 0 T 2 , 0 T 30 , and 0 S 30 if their Q values are 250, 130, and
183, respectively.
(b) How far have the Love and Rayleigh waves corresponding to
0 T 30 and 0 S 30 traveled during these times?
20. Show that for a damped harmonic oscillator, the quality factor
Q = 2πE/(−∆E), where E is the energy in the oscillating system, and
∆E is the amount of energy lost during one cycle of the oscillation.
21. Find the percentage shear wave velocity differences due to physical
dispersion between waves with periods of 1 and 10 s in the case of
(a) a hot back-arc basin (Q = 25),
(b) a cold lithospheric slab (Q = 250).
Explain physically what causes the difference between the results
for parts (a) and (b).
22. Show that α
2 − (4/3)β
2 = K/ρ and that Q
−1
α = LQ
−1
µ + (1 − L)Q
−1
K
where L = (4/3)(β/α) 2
23. Use the acceleration of gravity at the core–mantle boundary
(g = 10.7 m/s
2 ) to find the total mass and average density of earth’s
core.
24. Assuming that the earth is ellipsoidal, but otherwise homogeneous:
(a) What source location results in the greatest amount of
antipodal defocusing of surface waves?
(b) What source location results in the least amount of
antipodal defocusing of surface waves?
(c) For (a), estimate the approximate time range for the earliest
and latest arrival of a surface wave with a phase velocity of
4.0 km/s.
Computer problems
C-1. Write a program to trace direct, reflected, and head wave paths
for a dipping layer over a halfspace. Have the program compute
the travel time for each path from the length of the path in each
material (i.e., rather than using the analytic expressions for travel
time). Use the program to replicate the results of problem 5.