

Problems 213
Time
− x/8 (s)
8
6
4
2
0
10
20
30
40
50
60
70
80
Distance (km)
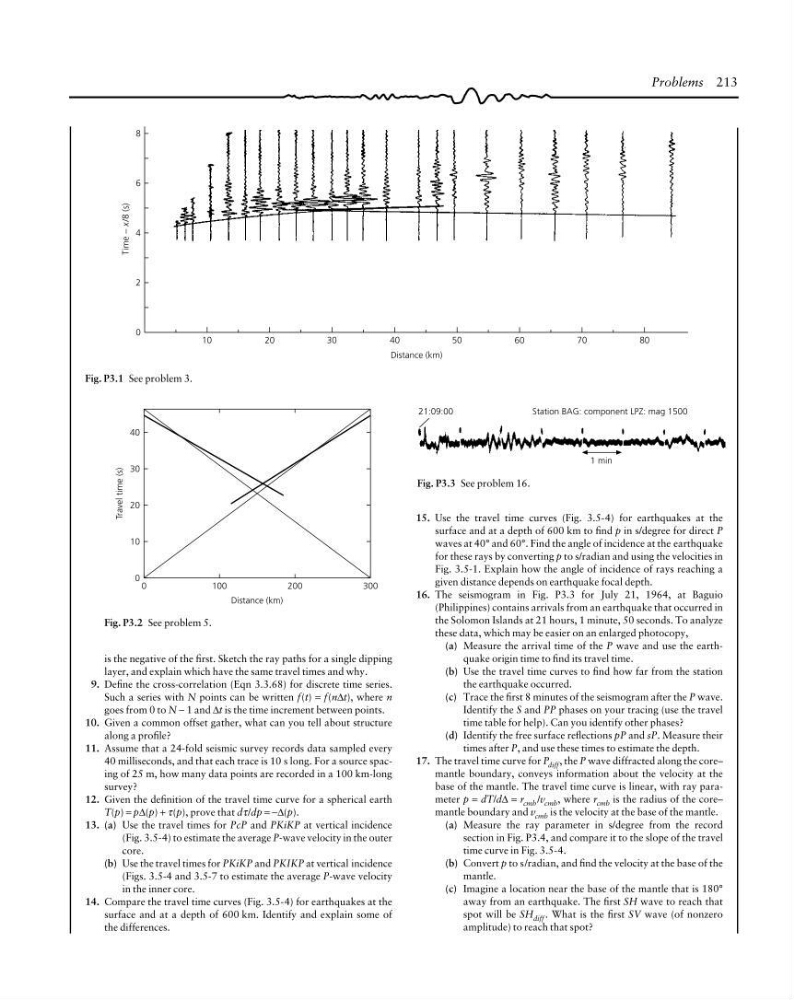
Fig. P3.1 See problem 3.
40
30
20
10
0
Travel time (s)
0
100
200
300
Distance (km)
Fig. P3.2 See problem 5.
Fig. P3.3 See problem 16.
21:09:00
Station BAG: component LPZ: mag 1500
1 min
is the negative of the first. Sketch the ray paths for a single dipping
layer, and explain which have the same travel times and why.
9. Define the cross-correlation (Eqn 3.3.68) for discrete time series.
Such a series with N points can be written f(t) = f(n∆t), where n
goes from 0 to N − 1 and ∆t is the time increment between points.
10. Given a common offset gather, what can you tell about structure
along a profile?
11. Assume that a 24-fold seismic survey records data sampled every
40 milliseconds, and that each trace is 10 s long. For a source spacing of 25 m, how many data points are recorded in a 100 km-long
survey?
12. Given the definition of the travel time curve for a spherical earth
T(p) = p∆(p) + τ(p), prove that dτ/dp = −∆(p).
13. (a) Use the travel times for PcP and PKiKP at vertical incidence
(Fig. 3.5-4) to estimate the average P-wave velocity in the outer
core.
(b) Use the travel times for PKiKP and PKIKP at vertical incidence
(Figs. 3.5-4 and 3.5-7 to estimate the average P-wave velocity
in the inner core.
14. Compare the travel time curves (Fig. 3.5-4) for earthquakes at the
surface and at a depth of 600 km. Identify and explain some of
the differences.
15. Use the travel time curves (Fig. 3.5-4) for earthquakes at the
surface and at a depth of 600 km to find p in s/degree for direct P
waves at 40° and 60°. Find the angle of incidence at the earthquake
for these rays by converting p to s/radian and using the velocities in
Fig. 3.5-1. Explain how the angle of incidence of rays reaching a
given distance depends on earthquake focal depth.
16. The seismogram in Fig. P3.3 for July 21, 1964, at Baguio
(Philippines) contains arrivals from an earthquake that occurred in
the Solomon Islands at 21 hours, 1 minute, 50 seconds. To analyze
these data, which may be easier on an enlarged photocopy,
(a) Measure the arrival time of the P wave and use the earthquake origin time to find its travel time.
(b) Use the travel time curves to find how far from the station
the earthquake occurred.
(c) Trace the first 8 minutes of the seismogram after the P wave.
Identify the S and PP phases on your tracing (use the travel
time table for help). Can you identify other phases?
(d) Identify the free surface reflections pP and sP. Measure their
times after P, and use these times to estimate the depth.
17. The travel time curve for P diff , the P wave diffracted along the core–
mantle boundary, conveys information about the velocity at the
base of the mantle. The travel time curve is linear, with ray parameter p = dT/d∆ = r cmb /v cmb , where r cmb is the radius of the core–
mantle boundary and v cmb is the velocity at the base of the mantle.
(a) Measure the ray parameter in s/degree from the record
section in Fig. P3.4, and compare it to the slope of the travel
time curve in Fig. 3.5-4.
(b) Convert p to s/radian, and find the velocity at the base of the
mantle.
(c) Imagine a location near the base of the mantle that is 180°
away from an earthquake. The first SH wave to reach that
spot will be SH diff . What is the first SV wave (of nonzero
amplitude) to reach that spot?
Time
− x/8 (s)
8
6
4
2
0
10
20
30
40
50
60
70
80
Distance (km)
Fig. P3.1 See problem 3.
40
30
20
10
0
Travel time (s)
0
100
200
300
Distance (km)
Fig. P3.2 See problem 5.
Fig. P3.3 See problem 16.
21:09:00
Station BAG: component LPZ: mag 1500
1 min
is the negative of the first. Sketch the ray paths for a single dipping
layer, and explain which have the same travel times and why.
9. Define the cross-correlation (Eqn 3.3.68) for discrete time series.
Such a series with N points can be written f(t) = f(n∆t), where n
goes from 0 to N − 1 and ∆t is the time increment between points.
10. Given a common offset gather, what can you tell about structure
along a profile?
11. Assume that a 24-fold seismic survey records data sampled every
40 milliseconds, and that each trace is 10 s long. For a source spacing of 25 m, how many data points are recorded in a 100 km-long
survey?
12. Given the definition of the travel time curve for a spherical earth
T(p) = p∆(p) + τ(p), prove that dτ/dp = −∆(p).
13. (a) Use the travel times for PcP and PKiKP at vertical incidence
(Fig. 3.5-4) to estimate the average P-wave velocity in the outer
core.
(b) Use the travel times for PKiKP and PKIKP at vertical incidence
(Figs. 3.5-4 and 3.5-7 to estimate the average P-wave velocity
in the inner core.
14. Compare the travel time curves (Fig. 3.5-4) for earthquakes at the
surface and at a depth of 600 km. Identify and explain some of
the differences.
15. Use the travel time curves (Fig. 3.5-4) for earthquakes at the
surface and at a depth of 600 km to find p in s/degree for direct P
waves at 40° and 60°. Find the angle of incidence at the earthquake
for these rays by converting p to s/radian and using the velocities in
Fig. 3.5-1. Explain how the angle of incidence of rays reaching a
given distance depends on earthquake focal depth.
16. The seismogram in Fig. P3.3 for July 21, 1964, at Baguio
(Philippines) contains arrivals from an earthquake that occurred in
the Solomon Islands at 21 hours, 1 minute, 50 seconds. To analyze
these data, which may be easier on an enlarged photocopy,
(a) Measure the arrival time of the P wave and use the earthquake origin time to find its travel time.
(b) Use the travel time curves to find how far from the station
the earthquake occurred.
(c) Trace the first 8 minutes of the seismogram after the P wave.
Identify the S and PP phases on your tracing (use the travel
time table for help). Can you identify other phases?
(d) Identify the free surface reflections pP and sP. Measure their
times after P, and use these times to estimate the depth.
17. The travel time curve for P diff , the P wave diffracted along the core–
mantle boundary, conveys information about the velocity at the
base of the mantle. The travel time curve is linear, with ray parameter p = dT/d∆ = r cmb /v cmb , where r cmb is the radius of the core–
mantle boundary and v cmb is the velocity at the base of the mantle.
(a) Measure the ray parameter in s/degree from the record
section in Fig. P3.4, and compare it to the slope of the travel
time curve in Fig. 3.5-4.
(b) Convert p to s/radian, and find the velocity at the base of the
mantle.
(c) Imagine a location near the base of the mantle that is 180°
away from an earthquake. The first SH wave to reach that
spot will be SH diff . What is the first SV wave (of nonzero
amplitude) to reach that spot?