

208 Seismology and Earth Structure
Lower mantle
(a)
down
D″
up
down
up
Lower mantle
(b)
Slab
D″
Plume
down
up
Dregs
Lower mantle
(c)
Slab
D″
Plume
down
up
Post-crust
Lower mantle
(d)
Slab
D″
Plume
down
up
Mw + St
Pv + Mw
Seismic velocity
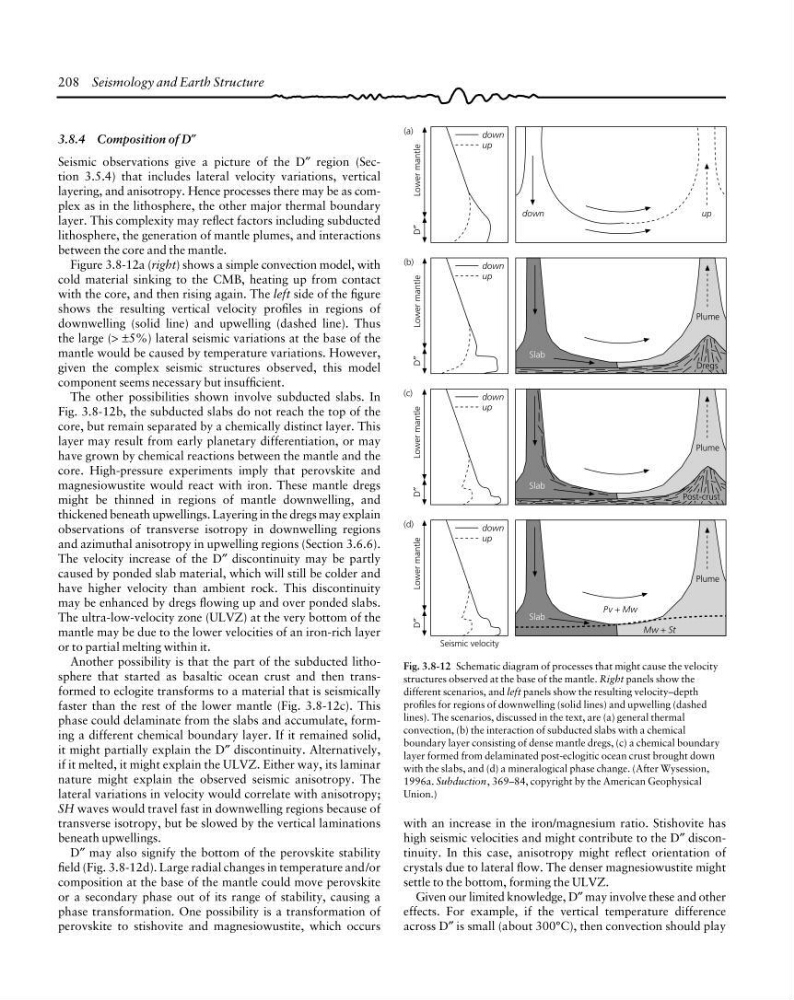
Fig. 3.8-12 Schematic diagram of processes that might cause the velocity
structures observed at the base of the mantle. Right panels show the
different scenarios, and left panels show the resulting velocity–depth
profiles for regions of downwelling (solid lines) and upwelling (dashed
lines). The scenarios, discussed in the text, are (a) general thermal
convection, (b) the interaction of subducted slabs with a chemical
boundary layer consisting of dense mantle dregs, (c) a chemical boundary
layer formed from delaminated post-eclogitic ocean crust brought down
with the slabs, and (d) a mineralogical phase change. (After Wysession,
1996a. Subduction, 369–84, copyright by the American Geophysical
Union.)
3.8.4 Composition of D″
Seismic observations give a picture of the D″ region (Section 3.5.4) that includes lateral velocity variations, vertical
layering, and anisotropy. Hence processes there may be as complex as in the lithosphere, the other major thermal boundary
layer. This complexity may reflect factors including subducted
lithosphere, the generation of mantle plumes, and interactions
between the core and the mantle.
Figure 3.8-12a (right) shows a simple convection model, with
cold material sinking to the CMB, heating up from contact
with the core, and then rising again. The left side of the figure
shows the resulting vertical velocity profiles in regions of
downwelling (solid line) and upwelling (dashed line). Thus
the large (> ±5%) lateral seismic variations at the base of the
mantle would be caused by temperature variations. However,
given the complex seismic structures observed, this model
component seems necessary but insufficient.
The other possibilities shown involve subducted slabs. In
Fig. 3.8-12b, the subducted slabs do not reach the top of the
core, but remain separated by a chemically distinct layer. This
layer may result from early planetary differentiation, or may
have grown by chemical reactions between the mantle and the
core. High-pressure experiments imply that perovskite and
magnesiowustite would react with iron. These mantle dregs
might be thinned in regions of mantle downwelling, and
thickened beneath upwellings. Layering in the dregs may explain
observations of transverse isotropy in downwelling regions
and azimuthal anisotropy in upwelling regions (Section 3.6.6).
The velocity increase of the D″ discontinuity may be partly
caused by ponded slab material, which will still be colder and
have higher velocity than ambient rock. This discontinuity
may be enhanced by dregs flowing up and over ponded slabs.
The ultra-low-velocity zone (ULVZ) at the very bottom of the
mantle may be due to the lower velocities of an iron-rich layer
or to partial melting within it.
Another possibility is that the part of the subducted lithosphere that started as basaltic ocean crust and then transformed to eclogite transforms to a material that is seismically
faster than the rest of the lower mantle (Fig. 3.8-12c). This
phase could delaminate from the slabs and accumulate, forming a different chemical boundary layer. If it remained solid,
it might partially explain the D″ discontinuity. Alternatively,
if it melted, it might explain the ULVZ. Either way, its laminar
nature might explain the observed seismic anisotropy. The
lateral variations in velocity would correlate with anisotropy;
SH waves would travel fast in downwelling regions because of
transverse isotropy, but be slowed by the vertical laminations
beneath upwellings.
D″ may also signify the bottom of the perovskite stability
field (Fig. 3.8-12d). Large radial changes in temperature and/or
composition at the base of the mantle could move perovskite
or a secondary phase out of its range of stability, causing a
phase transformation. One possibility is a transformation of
perovskite to stishovite and magnesiowustite, which occurs
with an increase in the iron/magnesium ratio. Stishovite has
high seismic velocities and might contribute to the D″ discontinuity. In this case, anisotropy might reflect orientation of
crystals due to lateral flow. The denser magnesiowustite might
settle to the bottom, forming the ULVZ.
Given our limited knowledge, D″ may involve these and other
effects. For example, if the vertical temperature difference
across D″ is small (about 300°C), then convection should play
Lower mantle
(a)
down
D″
up
down
up
Lower mantle
(b)
Slab
D″
Plume
down
up
Dregs
Lower mantle
(c)
Slab
D″
Plume
down
up
Post-crust
Lower mantle
(d)
Slab
D″
Plume
down
up
Mw + St
Pv + Mw
Seismic velocity
Fig. 3.8-12 Schematic diagram of processes that might cause the velocity
structures observed at the base of the mantle. Right panels show the
different scenarios, and left panels show the resulting velocity–depth
profiles for regions of downwelling (solid lines) and upwelling (dashed
lines). The scenarios, discussed in the text, are (a) general thermal
convection, (b) the interaction of subducted slabs with a chemical
boundary layer consisting of dense mantle dregs, (c) a chemical boundary
layer formed from delaminated post-eclogitic ocean crust brought down
with the slabs, and (d) a mineralogical phase change. (After Wysession,
1996a. Subduction, 369–84, copyright by the American Geophysical
Union.)
3.8.4 Composition of D″
Seismic observations give a picture of the D″ region (Section 3.5.4) that includes lateral velocity variations, vertical
layering, and anisotropy. Hence processes there may be as complex as in the lithosphere, the other major thermal boundary
layer. This complexity may reflect factors including subducted
lithosphere, the generation of mantle plumes, and interactions
between the core and the mantle.
Figure 3.8-12a (right) shows a simple convection model, with
cold material sinking to the CMB, heating up from contact
with the core, and then rising again. The left side of the figure
shows the resulting vertical velocity profiles in regions of
downwelling (solid line) and upwelling (dashed line). Thus
the large (> ±5%) lateral seismic variations at the base of the
mantle would be caused by temperature variations. However,
given the complex seismic structures observed, this model
component seems necessary but insufficient.
The other possibilities shown involve subducted slabs. In
Fig. 3.8-12b, the subducted slabs do not reach the top of the
core, but remain separated by a chemically distinct layer. This
layer may result from early planetary differentiation, or may
have grown by chemical reactions between the mantle and the
core. High-pressure experiments imply that perovskite and
magnesiowustite would react with iron. These mantle dregs
might be thinned in regions of mantle downwelling, and
thickened beneath upwellings. Layering in the dregs may explain
observations of transverse isotropy in downwelling regions
and azimuthal anisotropy in upwelling regions (Section 3.6.6).
The velocity increase of the D″ discontinuity may be partly
caused by ponded slab material, which will still be colder and
have higher velocity than ambient rock. This discontinuity
may be enhanced by dregs flowing up and over ponded slabs.
The ultra-low-velocity zone (ULVZ) at the very bottom of the
mantle may be due to the lower velocities of an iron-rich layer
or to partial melting within it.
Another possibility is that the part of the subducted lithosphere that started as basaltic ocean crust and then transformed to eclogite transforms to a material that is seismically
faster than the rest of the lower mantle (Fig. 3.8-12c). This
phase could delaminate from the slabs and accumulate, forming a different chemical boundary layer. If it remained solid,
it might partially explain the D″ discontinuity. Alternatively,
if it melted, it might explain the ULVZ. Either way, its laminar
nature might explain the observed seismic anisotropy. The
lateral variations in velocity would correlate with anisotropy;
SH waves would travel fast in downwelling regions because of
transverse isotropy, but be slowed by the vertical laminations
beneath upwellings.
D″ may also signify the bottom of the perovskite stability
field (Fig. 3.8-12d). Large radial changes in temperature and/or
composition at the base of the mantle could move perovskite
or a secondary phase out of its range of stability, causing a
phase transformation. One possibility is a transformation of
perovskite to stishovite and magnesiowustite, which occurs
with an increase in the iron/magnesium ratio. Stishovite has
high seismic velocities and might contribute to the D″ discontinuity. In this case, anisotropy might reflect orientation of
crystals due to lateral flow. The denser magnesiowustite might
settle to the bottom, forming the ULVZ.
Given our limited knowledge, D″ may involve these and other
effects. For example, if the vertical temperature difference
across D″ is small (about 300°C), then convection should play