

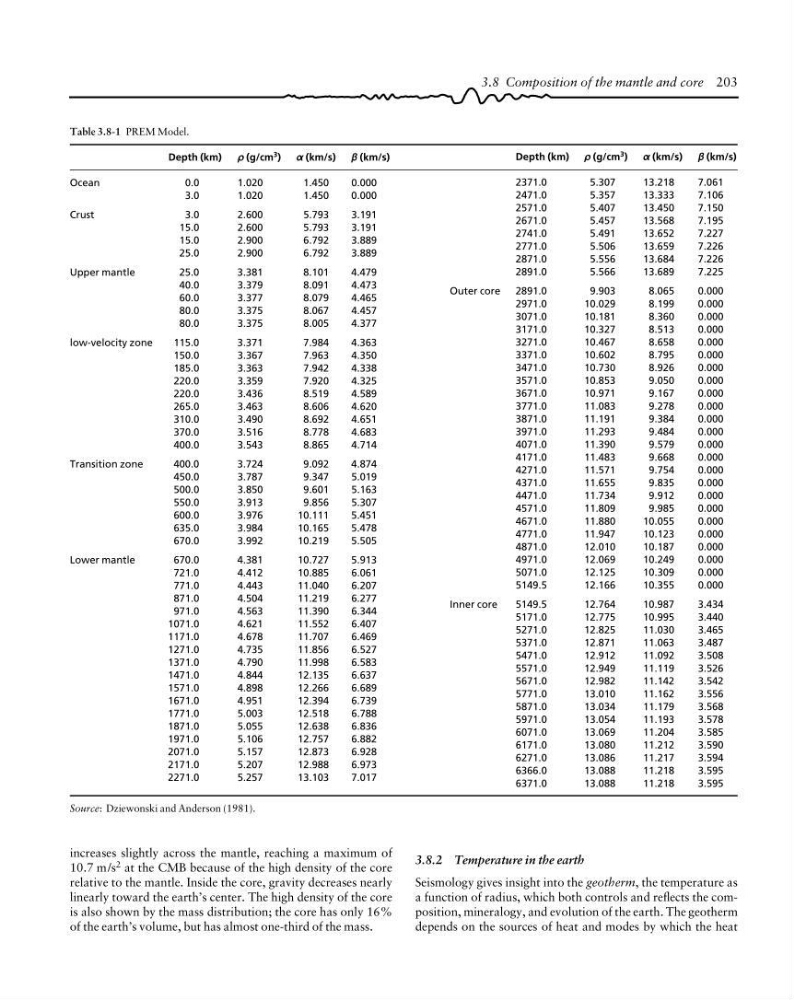
Table 3.8-1 PREM Model.
Depth (km)
r (g/cm
3 ) a (km/s)
b (km/s)
Ocean
0.0
1.020
1.450
0.000
3.0
1.020
1.450
0.000
Crust
3.0
2.600
5.793
3.191
15.0
2.600
5.793
3.191
15.0
2.900
6.792
3.889
25.0
2.900
6.792
3.889
Upper mantle
25.0
3.381
8.101
4.479
40.0
3.379
8.091
4.473
60.0
3.377
8.079
4.465
80.0
3.375
8.067
4.457
80.0
3.375
8.005
4.377
low-velocity zone
115.0
3.371
7.984
4.363
150.0
3.367
7.963
4.350
185.0
3.363
7.942
4.338
220.0
3.359
7.920
4.325
220.0
3.436
8.519
4.589
265.0
3.463
8.606
4.620
310.0
3.490
8.692
4.651
370.0
3.516
8.778
4.683
400.0
3.543
8.865
4.714
Transition zone
400.0
3.724
9.092
4.874
450.0
3.787
9.347
5.019
500.0
3.850
9.601
5.163
550.0
3.913
9.856
5.307
600.0
3.976
10.111
5.451
635.0
3.984
10.165
5.478
670.0
3.992
10.219
5.505
Lower mantle
670.0
4.381
10.727
5.913
721.0
4.412
10.885
6.061
771.0
4.443
11.040
6.207
871.0
4.504
11.219
6.277
971.0
4.563
11.390
6.344
1071.0
4.621
11.552
6.407
1171.0
4.678
11.707
6.469
1271.0
4.735
11.856
6.527
1371.0
4.790
11.998
6.583
1471.0
4.844
12.135
6.637
1571.0
4.898
12.266
6.689
1671.0
4.951
12.394
6.739
1771.0
5.003
12.518
6.788
1871.0
5.055
12.638
6.836
1971.0
5.106
12.757
6.882
2071.0
5.157
12.873
6.928
2171.0
5.207
12.988
6.973
2271.0
5.257
13.103
7.017
Depth (km) r (g/cm
3 ) a (km/s)
b (km/s)
2371.0
5.307
13.218
7.061
2471.0
5.357
13.333
7.106
2571.0
5.407
13.450
7.150
2671.0
5.457
13.568
7.195
2741.0
5.491
13.652
7.227
2771.0
5.506
13.659
7.226
2871.0
5.556
13.684
7.226
2891.0
5.566
13.689
7.225
Outer core 2891.0
9.903
8.065
0.000
2971.0
10.029
8.199
0.000
3071.0
10.181
8.360
0.000
3171.0
10.327
8.513
0.000
3271.0
10.467
8.658
0.000
3371.0
10.602
8.795
0.000
3471.0
10.730
8.926
0.000
3571.0
10.853
9.050
0.000
3671.0
10.971
9.167
0.000
3771.0
11.083
9.278
0.000
3871.0
11.191
9.384
0.000
3971.0
11.293
9.484
0.000
4071.0
11.390
9.579
0.000
4171.0
11.483
9.668
0.000
4271.0
11.571
9.754
0.000
4371.0
11.655
9.835
0.000
4471.0
11.734
9.912
0.000
4571.0
11.809
9.985
0.000
4671.0
11.880
10.055
0.000
4771.0
11.947
10.123
0.000
4871.0
12.010
10.187
0.000
4971.0
12.069
10.249
0.000
5071.0
12.125
10.309
0.000
5149.5
12.166
10.355
0.000
Inner core
5149.5
12.764
10.987
3.434
5171.0
12.775
10.995
3.440
5271.0
12.825
11.030
3.465
5371.0
12.871
11.063
3.487
5471.0
12.912
11.092
3.508
5571.0
12.949
11.119
3.526
5671.0
12.982
11.142
3.542
5771.0
13.010
11.162
3.556
5871.0
13.034
11.179
3.568
5971.0
13.054
11.193
3.578
6071.0
13.069
11.204
3.585
6171.0
13.080
11.212
3.590
6271.0
13.086
11.217
3.594
6366.0
13.088
11.218
3.595
6371.0
13.088
11.218
3.595
Source: Dziewonski and Anderson (1981).
3.8 Composition of the mantle and core 203
increases slightly across the mantle, reaching a maximum of
10.7 m/s 2 at the CMB because of the high density of the core
relative to the mantle. Inside the core, gravity decreases nearly
linearly toward the earth’s center. The high density of the core
is also shown by the mass distribution; the core has only 16%
of the earth’s volume, but has almost one-third of the mass.
3.8.2 Temperature in the earth
Seismology gives insight into the geotherm, the temperature as
a function of radius, which both controls and reflects the composition, mineralogy, and evolution of the earth. The geotherm
depends on the sources of heat and modes by which the heat
Depth (km)
r (g/cm
3 ) a (km/s)
b (km/s)
Ocean
0.0
1.020
1.450
0.000
3.0
1.020
1.450
0.000
Crust
3.0
2.600
5.793
3.191
15.0
2.600
5.793
3.191
15.0
2.900
6.792
3.889
25.0
2.900
6.792
3.889
Upper mantle
25.0
3.381
8.101
4.479
40.0
3.379
8.091
4.473
60.0
3.377
8.079
4.465
80.0
3.375
8.067
4.457
80.0
3.375
8.005
4.377
low-velocity zone
115.0
3.371
7.984
4.363
150.0
3.367
7.963
4.350
185.0
3.363
7.942
4.338
220.0
3.359
7.920
4.325
220.0
3.436
8.519
4.589
265.0
3.463
8.606
4.620
310.0
3.490
8.692
4.651
370.0
3.516
8.778
4.683
400.0
3.543
8.865
4.714
Transition zone
400.0
3.724
9.092
4.874
450.0
3.787
9.347
5.019
500.0
3.850
9.601
5.163
550.0
3.913
9.856
5.307
600.0
3.976
10.111
5.451
635.0
3.984
10.165
5.478
670.0
3.992
10.219
5.505
Lower mantle
670.0
4.381
10.727
5.913
721.0
4.412
10.885
6.061
771.0
4.443
11.040
6.207
871.0
4.504
11.219
6.277
971.0
4.563
11.390
6.344
1071.0
4.621
11.552
6.407
1171.0
4.678
11.707
6.469
1271.0
4.735
11.856
6.527
1371.0
4.790
11.998
6.583
1471.0
4.844
12.135
6.637
1571.0
4.898
12.266
6.689
1671.0
4.951
12.394
6.739
1771.0
5.003
12.518
6.788
1871.0
5.055
12.638
6.836
1971.0
5.106
12.757
6.882
2071.0
5.157
12.873
6.928
2171.0
5.207
12.988
6.973
2271.0
5.257
13.103
7.017
Depth (km) r (g/cm
3 ) a (km/s)
b (km/s)
2371.0
5.307
13.218
7.061
2471.0
5.357
13.333
7.106
2571.0
5.407
13.450
7.150
2671.0
5.457
13.568
7.195
2741.0
5.491
13.652
7.227
2771.0
5.506
13.659
7.226
2871.0
5.556
13.684
7.226
2891.0
5.566
13.689
7.225
Outer core 2891.0
9.903
8.065
0.000
2971.0
10.029
8.199
0.000
3071.0
10.181
8.360
0.000
3171.0
10.327
8.513
0.000
3271.0
10.467
8.658
0.000
3371.0
10.602
8.795
0.000
3471.0
10.730
8.926
0.000
3571.0
10.853
9.050
0.000
3671.0
10.971
9.167
0.000
3771.0
11.083
9.278
0.000
3871.0
11.191
9.384
0.000
3971.0
11.293
9.484
0.000
4071.0
11.390
9.579
0.000
4171.0
11.483
9.668
0.000
4271.0
11.571
9.754
0.000
4371.0
11.655
9.835
0.000
4471.0
11.734
9.912
0.000
4571.0
11.809
9.985
0.000
4671.0
11.880
10.055
0.000
4771.0
11.947
10.123
0.000
4871.0
12.010
10.187
0.000
4971.0
12.069
10.249
0.000
5071.0
12.125
10.309
0.000
5149.5
12.166
10.355
0.000
Inner core
5149.5
12.764
10.987
3.434
5171.0
12.775
10.995
3.440
5271.0
12.825
11.030
3.465
5371.0
12.871
11.063
3.487
5471.0
12.912
11.092
3.508
5571.0
12.949
11.119
3.526
5671.0
12.982
11.142
3.542
5771.0
13.010
11.162
3.556
5871.0
13.034
11.179
3.568
5971.0
13.054
11.193
3.578
6071.0
13.069
11.204
3.585
6171.0
13.080
11.212
3.590
6271.0
13.086
11.217
3.594
6366.0
13.088
11.218
3.595
6371.0
13.088
11.218
3.595
Source: Dziewonski and Anderson (1981).
3.8 Composition of the mantle and core 203
increases slightly across the mantle, reaching a maximum of
10.7 m/s 2 at the CMB because of the high density of the core
relative to the mantle. Inside the core, gravity decreases nearly
linearly toward the earth’s center. The high density of the core
is also shown by the mass distribution; the core has only 16%
of the earth’s volume, but has almost one-third of the mass.
3.8.2 Temperature in the earth
Seismology gives insight into the geotherm, the temperature as
a function of radius, which both controls and reflects the composition, mineralogy, and evolution of the earth. The geotherm
depends on the sources of heat and modes by which the heat