

202 Seismology and Earth Structure
14
12
10
8
6
4
2
Density
Gravity
Pressure
Mass
Depth (km)
0
1000 2000 3000 4000 5000 6000
350
300
250
200
150
100
50
0
10
8
6
4
2
0
5 × 10
24
4 × 10
24
3 × 10
24
2 × 10
24
1 × 10
24
0
kg
GPa
m /s
2
g /cm
3
ICB
CMB
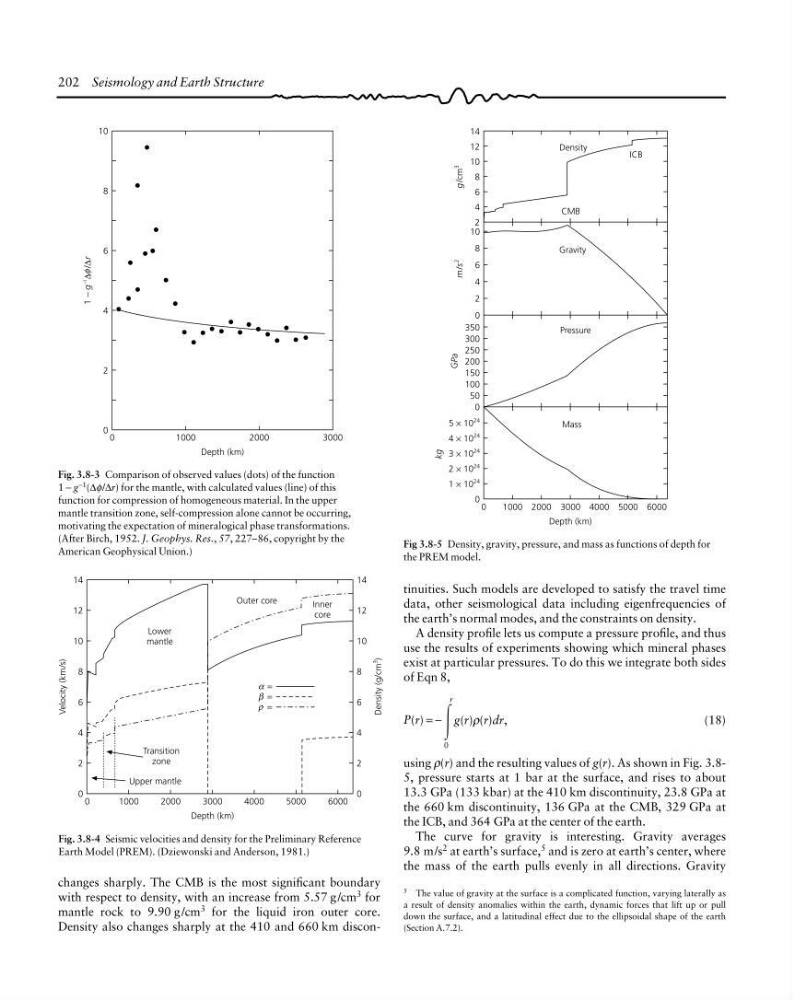
Fig 3.8-5 Density, gravity, pressure, and mass as functions of depth for
the PREM model.
5 The value of gravity at the surface is a complicated function, varying laterally as
a result of density anomalies within the earth, dynamic forces that lift up or pull
down the surface, and a latitudinal effect due to the ellipsoidal shape of the earth
(Section A.7.2).
10
8
6
4
2
0
Depth (km)
2000
1
− g
–1
∆ /∆r
φ
1000
0
3000
Fig. 3.8-3 Comparison of observed values (dots) of the function
1 − g
−1
(∆φ/∆r) for the mantle, with calculated values (line) of this
function for compression of homogeneous material. In the upper
mantle transition zone, self-compression alone cannot be occurring,
motivating the expectation of mineralogical phase transformations.
(After Birch, 1952. J. Geophys. Res., 57, 227–86, copyright by the
American Geophysical Union.)
14
12
10
8
6
4
2
0
Velocity (km/s)
Density (g/cm
3
)
Transition
zone
Lower
mantle
Outer core
Inner
core
Upper mantle
0
Depth (km)
1000
2000
3000
4000
5000
6000
14
12
10
8
6
4
2
0
α =
β =
ρ =
Fig. 3.8-4 Seismic velocities and density for the Preliminary Reference
Earth Model (PREM). (Dziewonski and Anderson, 1981.)
changes sharply. The CMB is the most significant boundary
with respect to density, with an increase from 5.57 g /cm 3 for
mantle rock to 9.90 g /cm 3 for the liquid iron outer core.
Density also changes sharply at the 410 and 660 km discontinuities. Such models are developed to satisfy the travel time
data, other seismological data including eigenfrequencies of
the earth’s normal modes, and the constraints on density.
A density profile lets us compute a pressure profile, and thus
use the results of experiments showing which mineral phases
exist at particular pressures. To do this we integrate both sides
of Eqn 8,
P(r) = −
Ύ
0
r
g(r)ρ(r)dr,
(18)
using ρ(r) and the resulting values of g(r). As shown in Fig. 3.85, pressure starts at 1 bar at the surface, and rises to about
13.3 GPa (133 kbar) at the 410 km discontinuity, 23.8 GPa at
the 660 km discontinuity, 136 GPa at the CMB, 329 GPa at
the ICB, and 364 GPa at the center of the earth.
The curve for gravity is interesting. Gravity averages
9.8 m/s 2 at earth’s surface, 5 and is zero at earth’s center, where
the mass of the earth pulls evenly in all directions. Gravity
14
12
10
8
6
4
2
Density
Gravity
Pressure
Mass
Depth (km)
0
1000 2000 3000 4000 5000 6000
350
300
250
200
150
100
50
0
10
8
6
4
2
0
5 × 10
24
4 × 10
24
3 × 10
24
2 × 10
24
1 × 10
24
0
kg
GPa
m /s
2
g /cm
3
ICB
CMB
Fig 3.8-5 Density, gravity, pressure, and mass as functions of depth for
the PREM model.
5 The value of gravity at the surface is a complicated function, varying laterally as
a result of density anomalies within the earth, dynamic forces that lift up or pull
down the surface, and a latitudinal effect due to the ellipsoidal shape of the earth
(Section A.7.2).
10
8
6
4
2
0
Depth (km)
2000
1
− g
–1
∆ /∆r
φ
1000
0
3000
Fig. 3.8-3 Comparison of observed values (dots) of the function
1 − g
−1
(∆φ/∆r) for the mantle, with calculated values (line) of this
function for compression of homogeneous material. In the upper
mantle transition zone, self-compression alone cannot be occurring,
motivating the expectation of mineralogical phase transformations.
(After Birch, 1952. J. Geophys. Res., 57, 227–86, copyright by the
American Geophysical Union.)
14
12
10
8
6
4
2
0
Velocity (km/s)
Density (g/cm
3
)
Transition
zone
Lower
mantle
Outer core
Inner
core
Upper mantle
0
Depth (km)
1000
2000
3000
4000
5000
6000
14
12
10
8
6
4
2
0
α =
β =
ρ =
Fig. 3.8-4 Seismic velocities and density for the Preliminary Reference
Earth Model (PREM). (Dziewonski and Anderson, 1981.)
changes sharply. The CMB is the most significant boundary
with respect to density, with an increase from 5.57 g /cm 3 for
mantle rock to 9.90 g /cm 3 for the liquid iron outer core.
Density also changes sharply at the 410 and 660 km discontinuities. Such models are developed to satisfy the travel time
data, other seismological data including eigenfrequencies of
the earth’s normal modes, and the constraints on density.
A density profile lets us compute a pressure profile, and thus
use the results of experiments showing which mineral phases
exist at particular pressures. To do this we integrate both sides
of Eqn 8,
P(r) = −
Ύ
0
r
g(r)ρ(r)dr,
(18)
using ρ(r) and the resulting values of g(r). As shown in Fig. 3.85, pressure starts at 1 bar at the surface, and rises to about
13.3 GPa (133 kbar) at the 410 km discontinuity, 23.8 GPa at
the 660 km discontinuity, 136 GPa at the CMB, 329 GPa at
the ICB, and 364 GPa at the center of the earth.
The curve for gravity is interesting. Gravity averages
9.8 m/s 2 at earth’s surface, 5 and is zero at earth’s center, where
the mass of the earth pulls evenly in all directions. Gravity