

198 Seismology and Earth Structure
0
10
20
30
40
50
60
Depth (km)
1000
1.0 0.3
0.1 Hz
B&R
Q
–1 (× 10
–3 )
β
Q β
EUS
200
100
60
0
5
10
15
20
0.1 Hz
0.3
1.0
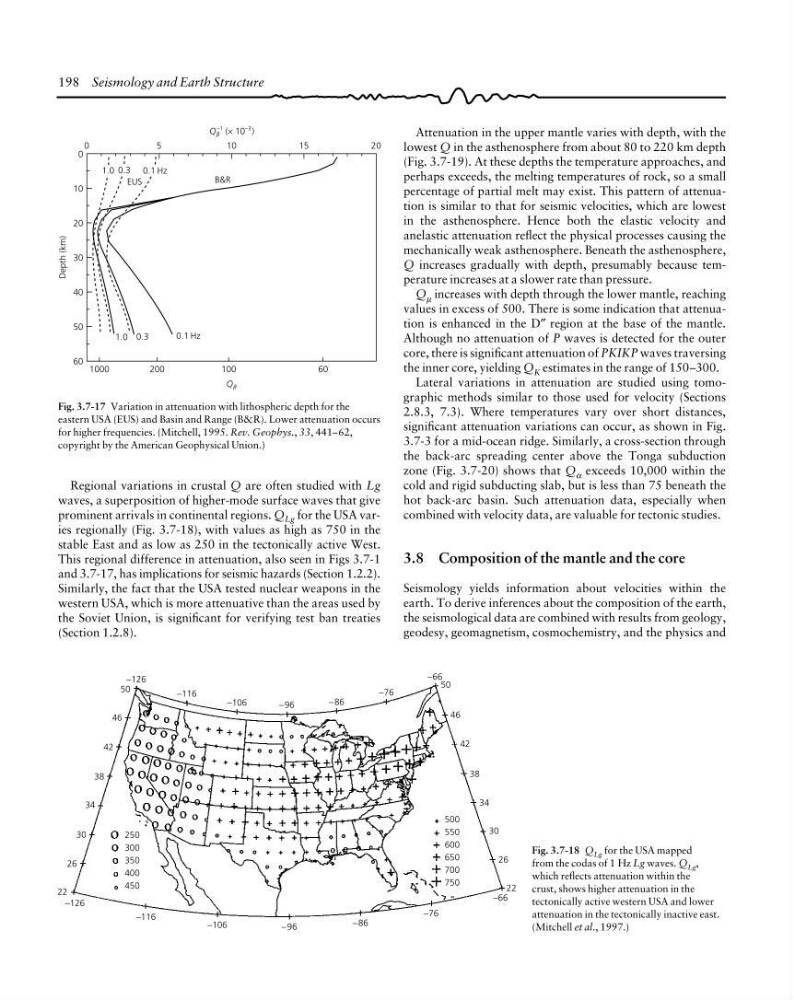
Fig. 3.7-17 Variation in attenuation with lithospheric depth for the
eastern USA (EUS) and Basin and Range (B&R). Lower attenuation occurs
for higher frequencies. (Mitchell, 1995. Rev. Geophys., 33, 441–62,
copyright by the American Geophysical Union.)
22
−126
22
500
550
600
650
700
750
−116
−106
−96
−86
−76
−66
34
26
30
38
42
46
50
−126
−116
−106
−96
−86
−76
−66
50
46
42
38
34
30
26
250
300
350
400
450
Fig. 3.7-18 Q Lg for the USA mapped
from the codas of 1 Hz Lg waves. Q Lg ,
which reflects attenuation within the
crust, shows higher attenuation in the
tectonically active western USA and lower
attenuation in the tectonically inactive east.
(Mitchell et al., 1997.)
Attenuation in the upper mantle varies with depth, with the
lowest Q in the asthenosphere from about 80 to 220 km depth
(Fig. 3.7-19). At these depths the temperature approaches, and
perhaps exceeds, the melting temperatures of rock, so a small
percentage of partial melt may exist. This pattern of attenuation is similar to that for seismic velocities, which are lowest
in the asthenosphere. Hence both the elastic velocity and
anelastic attenuation reflect the physical processes causing the
mechanically weak asthenosphere. Beneath the asthenosphere,
Q increases gradually with depth, presumably because temperature increases at a slower rate than pressure.
Q µ increases with depth through the lower mantle, reaching
values in excess of 500. There is some indication that attenuation is enhanced in the D″ region at the base of the mantle.
Although no attenuation of P waves is detected for the outer
core, there is significant attenuation of PKIKP waves traversing
the inner core, yielding Q K estimates in the range of 150–300.
Lateral variations in attenuation are studied using tomographic methods similar to those used for velocity (Sections
2.8.3, 7.3). Where temperatures vary over short distances,
significant attenuation variations can occur, as shown in Fig.
3.7-3 for a mid-ocean ridge. Similarly, a cross-section through
the back-arc spreading center above the Tonga subduction
zone (Fig. 3.7-20) shows that Q α exceeds 10,000 within the
cold and rigid subducting slab, but is less than 75 beneath the
hot back-arc basin. Such attenuation data, especially when
combined with velocity data, are valuable for tectonic studies.
3.8 Composition of the mantle and the core
Seismology yields information about velocities within the
earth. To derive inferences about the composition of the earth,
the seismological data are combined with results from geology,
geodesy, geomagnetism, cosmochemistry, and the physics and
Regional variations in crustal Q are often studied with Lg
waves, a superposition of higher-mode surface waves that give
prominent arrivals in continental regions. Q Lg for the USA varies regionally (Fig. 3.7-18), with values as high as 750 in the
stable East and as low as 250 in the tectonically active West.
This regional difference in attenuation, also seen in Figs 3.7-1
and 3.7-17, has implications for seismic hazards (Section 1.2.2).
Similarly, the fact that the USA tested nuclear weapons in the
western USA, which is more attenuative than the areas used by
the Soviet Union, is significant for verifying test ban treaties
(Section 1.2.8).
0
10
20
30
40
50
60
Depth (km)
1000
1.0 0.3
0.1 Hz
B&R
Q
–1 (× 10
–3 )
β
Q β
EUS
200
100
60
0
5
10
15
20
0.1 Hz
0.3
1.0
Fig. 3.7-17 Variation in attenuation with lithospheric depth for the
eastern USA (EUS) and Basin and Range (B&R). Lower attenuation occurs
for higher frequencies. (Mitchell, 1995. Rev. Geophys., 33, 441–62,
copyright by the American Geophysical Union.)
22
−126
22
500
550
600
650
700
750
−116
−106
−96
−86
−76
−66
34
26
30
38
42
46
50
−126
−116
−106
−96
−86
−76
−66
50
46
42
38
34
30
26
250
300
350
400
450
Fig. 3.7-18 Q Lg for the USA mapped
from the codas of 1 Hz Lg waves. Q Lg ,
which reflects attenuation within the
crust, shows higher attenuation in the
tectonically active western USA and lower
attenuation in the tectonically inactive east.
(Mitchell et al., 1997.)
Attenuation in the upper mantle varies with depth, with the
lowest Q in the asthenosphere from about 80 to 220 km depth
(Fig. 3.7-19). At these depths the temperature approaches, and
perhaps exceeds, the melting temperatures of rock, so a small
percentage of partial melt may exist. This pattern of attenuation is similar to that for seismic velocities, which are lowest
in the asthenosphere. Hence both the elastic velocity and
anelastic attenuation reflect the physical processes causing the
mechanically weak asthenosphere. Beneath the asthenosphere,
Q increases gradually with depth, presumably because temperature increases at a slower rate than pressure.
Q µ increases with depth through the lower mantle, reaching
values in excess of 500. There is some indication that attenuation is enhanced in the D″ region at the base of the mantle.
Although no attenuation of P waves is detected for the outer
core, there is significant attenuation of PKIKP waves traversing
the inner core, yielding Q K estimates in the range of 150–300.
Lateral variations in attenuation are studied using tomographic methods similar to those used for velocity (Sections
2.8.3, 7.3). Where temperatures vary over short distances,
significant attenuation variations can occur, as shown in Fig.
3.7-3 for a mid-ocean ridge. Similarly, a cross-section through
the back-arc spreading center above the Tonga subduction
zone (Fig. 3.7-20) shows that Q α exceeds 10,000 within the
cold and rigid subducting slab, but is less than 75 beneath the
hot back-arc basin. Such attenuation data, especially when
combined with velocity data, are valuable for tectonic studies.
3.8 Composition of the mantle and the core
Seismology yields information about velocities within the
earth. To derive inferences about the composition of the earth,
the seismological data are combined with results from geology,
geodesy, geomagnetism, cosmochemistry, and the physics and
Regional variations in crustal Q are often studied with Lg
waves, a superposition of higher-mode surface waves that give
prominent arrivals in continental regions. Q Lg for the USA varies regionally (Fig. 3.7-18), with values as high as 750 in the
stable East and as low as 250 in the tectonically active West.
This regional difference in attenuation, also seen in Figs 3.7-1
and 3.7-17, has implications for seismic hazards (Section 1.2.2).
Similarly, the fact that the USA tested nuclear weapons in the
western USA, which is more attenuative than the areas used by
the Soviet Union, is significant for verifying test ban treaties
(Section 1.2.8).