

Q
−1
0.012
0.010
0.008
0.006
0.004
0.002
0
10
6
Pairs of solute atoms
Grain boundary
Twin boundaries
Interstitial solute atoms
Transverse
thermal currents
Intercrystalline
thermal currents
Frequency (Hz)
10
–14 10
–12 10
–10
10
–8
10
–6
10
–4
10
–2
10
0
10
2
10
4
Frequency (Hz)
Q
−1
0.012
0.010
0.008
0.006
0.004
0.002
0
Q min ≈ 100
10
4
10
2
10
0
10
−2
10
−4
10
−6
10
−8
3.7 Attenuation and anelasticity 197
σ (t) = k 1 H(t) + k 2 e −t/τ ,
(55)
where τ is the relaxation time constant = η/k 2 .
The response to harmonic waves depends on the product
of the angular frequency and the relaxation time. For wave
periods that are very short compared to the relaxation time, the
system responds mostly elastically, and there is little attenuation. For wave periods much longer than the relaxation time,
the system responds mostly in a viscous manner, so there is no
attenuative loss of energy. As shown in Fig. 3.7-15, the attenuation 8 varies as
Q
k
k
−
=
+
1
2
1
2
1
( )
( )
.
ω
ωτ
ωτ
(56)
At very low or very high frequencies Q
−1
(ω) approaches zero,
so Q becomes infinite. The greatest attenuation, or absorption
peak, 9 occurs at ωτ = 1, where
Q m
−1
ax = Q −1 (1/τ) = k 2 /2k 1 .
(57)
The phase velocity also depends on ωτ:
c
c
k
k
( )
( )
( )
,
ω
ωτ
ωτ
=
+
+
⎡
⎣
⎢
⎢
⎤
⎦
⎥
⎥
0
2
1
2
2
1
2 1
(58)
where c 0 = (k 1 /ρ) 1/2 . The phase velocity is lowest (c 0 ) at low frequencies, and reaches
c ∞ = c 0 (1 + k 2 /2k 1 ) = c 0 (1 + Q m
−1
ax )
(59)
at high frequencies. This model thus has the key feature of the
physical dispersion relation (Eqn 51) discussed earlier, that
long-period waves travel more slowly than high-frequency
waves.
Given this model, the fact that seismological observations
find relatively constant Q over a large range of low frequencies from about 0.001 to 0.1 Hz (Fig. 3.7-12) is surprising.
Moreover, theoretical and laboratory studies of the physical
mechanisms thought to cause attenuation in the earth also
suggest that Q should be strongly frequency-dependent. Hence
the relatively constant value at low frequencies is thought to
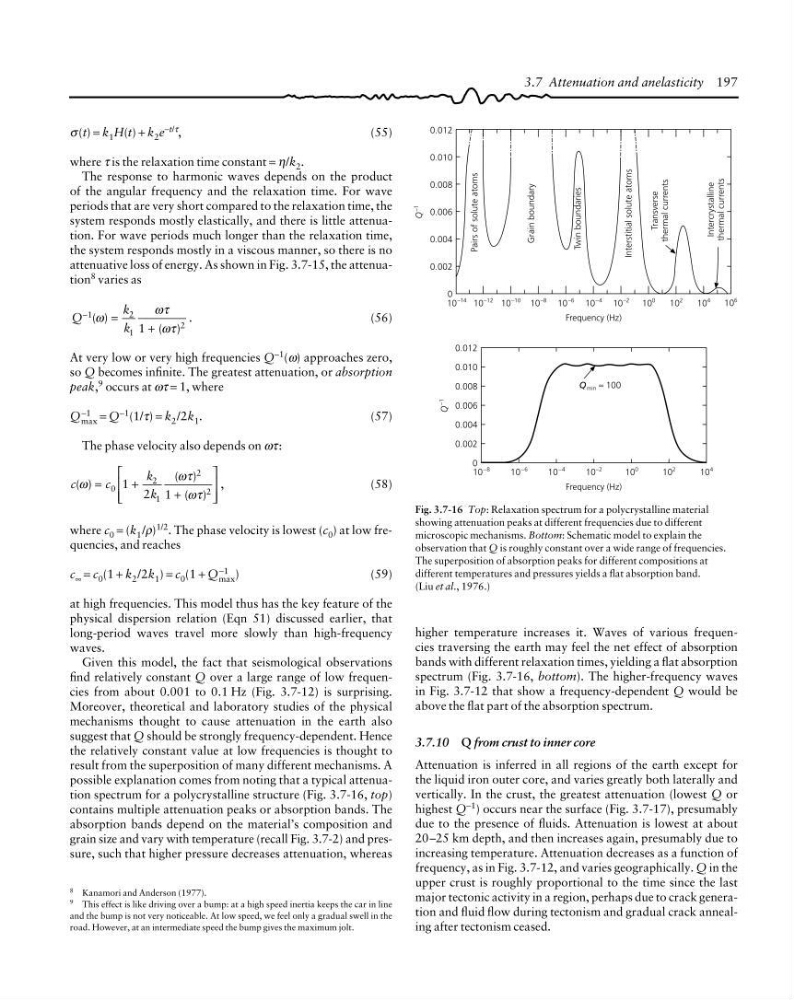
result from the superposition of many different mechanisms. A
possible explanation comes from noting that a typical attenuation spectrum for a polycrystalline structure (Fig. 3.7-16, top)
contains multiple attenuation peaks or absorption bands. The
absorption bands depend on the material’s composition and
grain size and vary with temperature (recall Fig. 3.7-2) and pressure, such that higher pressure decreases attenuation, whereas
Fig. 3.7-16 Top: Relaxation spectrum for a polycrystalline material
showing attenuation peaks at different frequencies due to different
microscopic mechanisms. Bottom: Schematic model to explain the
observation that Q is roughly constant over a wide range of frequencies.
The superposition of absorption peaks for different compositions at
different temperatures and pressures yields a flat absorption band.
(Liu et al., 1976.)
8 Kanamori and Anderson (1977).
9 This effect is like driving over a bump: at a high speed inertia keeps the car in line
and the bump is not very noticeable. At low speed, we feel only a gradual swell in the
road. However, at an intermediate speed the bump gives the maximum jolt.
higher temperature increases it. Waves of various frequencies traversing the earth may feel the net effect of absorption
bands with different relaxation times, yielding a flat absorption
spectrum (Fig. 3.7-16, bottom). The higher-frequency waves
in Fig. 3.7-12 that show a frequency-dependent Q would be
above the flat part of the absorption spectrum.
3.7.10 Q from crust to inner core
Attenuation is inferred in all regions of the earth except for
the liquid iron outer core, and varies greatly both laterally and
vertically. In the crust, the greatest attenuation (lowest Q or
highest Q −1 ) occurs near the surface (Fig. 3.7-17), presumably
due to the presence of fluids. Attenuation is lowest at about
20–25 km depth, and then increases again, presumably due to
increasing temperature. Attenuation decreases as a function of
frequency, as in Fig. 3.7-12, and varies geographically. Q in the
upper crust is roughly proportional to the time since the last
major tectonic activity in a region, perhaps due to crack generation and fluid flow during tectonism and gradual crack annealing after tectonism ceased.
−1
0.012
0.010
0.008
0.006
0.004
0.002
0
10
6
Pairs of solute atoms
Grain boundary
Twin boundaries
Interstitial solute atoms
Transverse
thermal currents
Intercrystalline
thermal currents
Frequency (Hz)
10
–14 10
–12 10
–10
10
–8
10
–6
10
–4
10
–2
10
0
10
2
10
4
Frequency (Hz)
Q
−1
0.012
0.010
0.008
0.006
0.004
0.002
0
Q min ≈ 100
10
4
10
2
10
0
10
−2
10
−4
10
−6
10
−8
3.7 Attenuation and anelasticity 197
σ (t) = k 1 H(t) + k 2 e −t/τ ,
(55)
where τ is the relaxation time constant = η/k 2 .
The response to harmonic waves depends on the product
of the angular frequency and the relaxation time. For wave
periods that are very short compared to the relaxation time, the
system responds mostly elastically, and there is little attenuation. For wave periods much longer than the relaxation time,
the system responds mostly in a viscous manner, so there is no
attenuative loss of energy. As shown in Fig. 3.7-15, the attenuation 8 varies as
Q
k
k
−
=
+
1
2
1
2
1
( )
( )
.
ω
ωτ
ωτ
(56)
At very low or very high frequencies Q
−1
(ω) approaches zero,
so Q becomes infinite. The greatest attenuation, or absorption
peak, 9 occurs at ωτ = 1, where
Q m
−1
ax = Q −1 (1/τ) = k 2 /2k 1 .
(57)
The phase velocity also depends on ωτ:
c
c
k
k
( )
( )
( )
,
ω
ωτ
ωτ
=
+
+
⎡
⎣
⎢
⎢
⎤
⎦
⎥
⎥
0
2
1
2
2
1
2 1
(58)
where c 0 = (k 1 /ρ) 1/2 . The phase velocity is lowest (c 0 ) at low frequencies, and reaches
c ∞ = c 0 (1 + k 2 /2k 1 ) = c 0 (1 + Q m
−1
ax )
(59)
at high frequencies. This model thus has the key feature of the
physical dispersion relation (Eqn 51) discussed earlier, that
long-period waves travel more slowly than high-frequency
waves.
Given this model, the fact that seismological observations
find relatively constant Q over a large range of low frequencies from about 0.001 to 0.1 Hz (Fig. 3.7-12) is surprising.
Moreover, theoretical and laboratory studies of the physical
mechanisms thought to cause attenuation in the earth also
suggest that Q should be strongly frequency-dependent. Hence
the relatively constant value at low frequencies is thought to
result from the superposition of many different mechanisms. A
possible explanation comes from noting that a typical attenuation spectrum for a polycrystalline structure (Fig. 3.7-16, top)
contains multiple attenuation peaks or absorption bands. The
absorption bands depend on the material’s composition and
grain size and vary with temperature (recall Fig. 3.7-2) and pressure, such that higher pressure decreases attenuation, whereas
Fig. 3.7-16 Top: Relaxation spectrum for a polycrystalline material
showing attenuation peaks at different frequencies due to different
microscopic mechanisms. Bottom: Schematic model to explain the
observation that Q is roughly constant over a wide range of frequencies.
The superposition of absorption peaks for different compositions at
different temperatures and pressures yields a flat absorption band.
(Liu et al., 1976.)
8 Kanamori and Anderson (1977).
9 This effect is like driving over a bump: at a high speed inertia keeps the car in line
and the bump is not very noticeable. At low speed, we feel only a gradual swell in the
road. However, at an intermediate speed the bump gives the maximum jolt.
higher temperature increases it. Waves of various frequencies traversing the earth may feel the net effect of absorption
bands with different relaxation times, yielding a flat absorption
spectrum (Fig. 3.7-16, bottom). The higher-frequency waves
in Fig. 3.7-12 that show a frequency-dependent Q would be
above the flat part of the absorption spectrum.
3.7.10 Q from crust to inner core
Attenuation is inferred in all regions of the earth except for
the liquid iron outer core, and varies greatly both laterally and
vertically. In the crust, the greatest attenuation (lowest Q or
highest Q −1 ) occurs near the surface (Fig. 3.7-17), presumably
due to the presence of fluids. Attenuation is lowest at about
20–25 km depth, and then increases again, presumably due to
increasing temperature. Attenuation decreases as a function of
frequency, as in Fig. 3.7-12, and varies geographically. Q in the
upper crust is roughly proportional to the time since the last
major tectonic activity in a region, perhaps due to crack generation and fluid flow during tectonism and gradual crack annealing after tectonism ceased.