

184 Seismology and Earth Structure
Perovskite
Anisotropy (%)
8
4
0
−4
−8
SH/SV
Silica
Periclase
0
2 0
4 0
6 0
8 0
1 0 0
1 2 0
Pressure (GPa)
6
4
2
0
−2
Data
means
Model
(fcc)
Model (hcp)
0
2 0
4 0
6 0
8 0
ξ
t
BC
− t
DF (s)
δ
δ
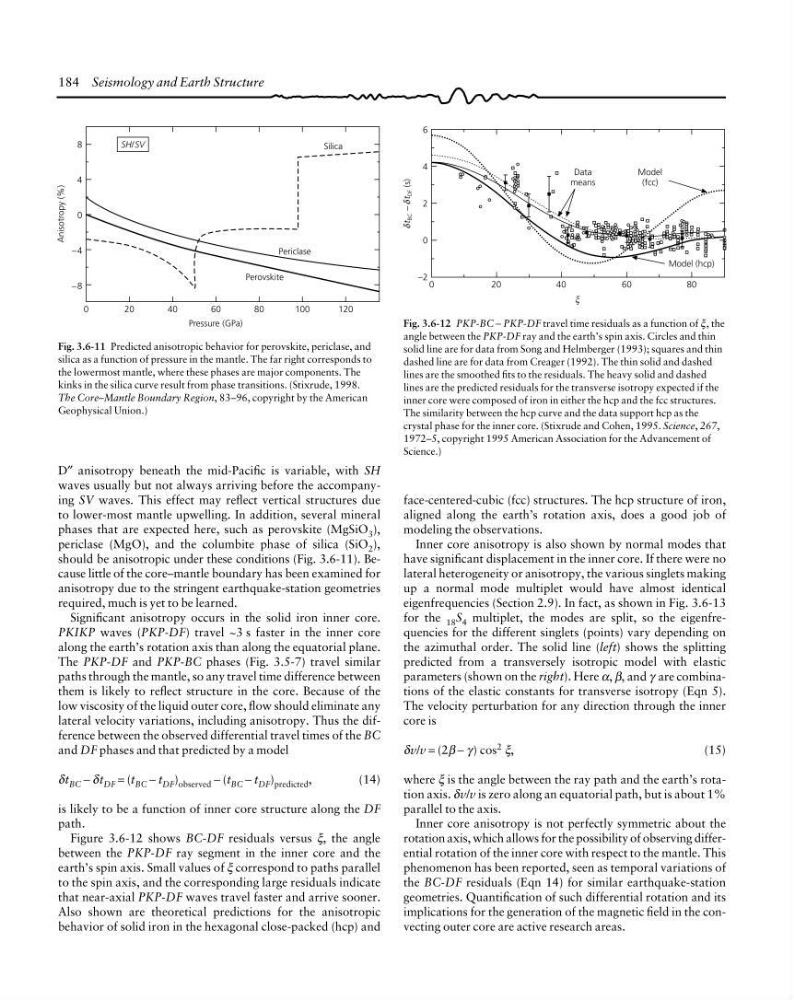
Fig. 3.6-12 PKP-BC − PKP-DF travel time residuals as a function of ξ, the
angle between the PKP-DF ray and the earth’s spin axis. Circles and thin
solid line are for data from Song and Helmberger (1993); squares and thin
dashed line are for data from Creager (1992). The thin solid and dashed
lines are the smoothed fits to the residuals. The heavy solid and dashed
lines are the predicted residuals for the transverse isotropy expected if the
inner core were composed of iron in either the hcp and the fcc structures.
The similarity between the hcp curve and the data support hcp as the
crystal phase for the inner core. (Stixrude and Cohen, 1995. Science, 267,
1972–5, copyright 1995 American Association for the Advancement of
Science.)
Fig. 3.6-11 Predicted anisotropic behavior for perovskite, periclase, and
silica as a function of pressure in the mantle. The far right corresponds to
the lowermost mantle, where these phases are major components. The
kinks in the silica curve result from phase transitions. (Stixrude, 1998.
The Core–Mantle Boundary Region, 83–96, copyright by the American
Geophysical Union.)
face-centered-cubic (fcc) structures. The hcp structure of iron,
aligned along the earth’s rotation axis, does a good job of
modeling the observations.
Inner core anisotropy is also shown by normal modes that
have significant displacement in the inner core. If there were no
lateral heterogeneity or anisotropy, the various singlets making
up a normal mode multiplet would have almost identical
eigenfrequencies (Section 2.9). In fact, as shown in Fig. 3.6-13
for the 18 S 4 multiplet, the modes are split, so the eigenfrequencies for the different singlets (points) vary depending on
the azimuthal order. The solid line (left) shows the splitting
predicted from a transversely isotropic model with elastic
parameters (shown on the right). Here α, β, and γ are combinations of the elastic constants for transverse isotropy (Eqn 5).
The velocity perturbation for any direction through the inner
core is
δv/v = (2β − γ ) cos 2 ξ,
(15)
where ξ is the angle between the ray path and the earth’s rotation axis. δv/v is zero along an equatorial path, but is about 1%
parallel to the axis.
Inner core anisotropy is not perfectly symmetric about the
rotation axis, which allows for the possibility of observing differential rotation of the inner core with respect to the mantle. This
phenomenon has been reported, seen as temporal variations of
the BC-DF residuals (Eqn 14) for similar earthquake-station
geometries. Quantification of such differential rotation and its
implications for the generation of the magnetic field in the convecting outer core are active research areas.
D″ anisotropy beneath the mid-Pacific is variable, with SH
waves usually but not always arriving before the accompanying SV waves. This effect may reflect vertical structures due
to lower-most mantle upwelling. In addition, several mineral
phases that are expected here, such as perovskite (MgSiO 3 ),
periclase (MgO), and the columbite phase of silica (SiO 2 ),
should be anisotropic under these conditions (Fig. 3.6-11). Because little of the core–mantle boundary has been examined for
anisotropy due to the stringent earthquake-station geometries
required, much is yet to be learned.
Significant anisotropy occurs in the solid iron inner core.
PKIKP waves (PKP-DF) travel ~3 s faster in the inner core
along the earth’s rotation axis than along the equatorial plane.
The PKP-DF and PKP-BC phases (Fig. 3.5-7) travel similar
paths through the mantle, so any travel time difference between
them is likely to reflect structure in the core. Because of the
low viscosity of the liquid outer core, flow should eliminate any
lateral velocity variations, including anisotropy. Thus the difference between the observed differential travel times of the BC
and DF phases and that predicted by a model
δt BC − δt DF = (t BC − t DF ) observed − (t BC − t DF ) predicted ,
(14)
is likely to be a function of inner core structure along the DF
path.
Figure 3.6-12 shows BC-DF residuals versus ξ, the angle
between the PKP-DF ray segment in the inner core and the
earth’s spin axis. Small values of ξ correspond to paths parallel
to the spin axis, and the corresponding large residuals indicate
that near-axial PKP-DF waves travel faster and arrive sooner.
Also shown are theoretical predictions for the anisotropic
behavior of solid iron in the hexagonal close-packed (hcp) and
Perovskite
Anisotropy (%)
8
4
0
−4
−8
SH/SV
Silica
Periclase
0
2 0
4 0
6 0
8 0
1 0 0
1 2 0
Pressure (GPa)
6
4
2
0
−2
Data
means
Model
(fcc)
Model (hcp)
0
2 0
4 0
6 0
8 0
ξ
t
BC
− t
DF (s)
δ
δ
Fig. 3.6-12 PKP-BC − PKP-DF travel time residuals as a function of ξ, the
angle between the PKP-DF ray and the earth’s spin axis. Circles and thin
solid line are for data from Song and Helmberger (1993); squares and thin
dashed line are for data from Creager (1992). The thin solid and dashed
lines are the smoothed fits to the residuals. The heavy solid and dashed
lines are the predicted residuals for the transverse isotropy expected if the
inner core were composed of iron in either the hcp and the fcc structures.
The similarity between the hcp curve and the data support hcp as the
crystal phase for the inner core. (Stixrude and Cohen, 1995. Science, 267,
1972–5, copyright 1995 American Association for the Advancement of
Science.)
Fig. 3.6-11 Predicted anisotropic behavior for perovskite, periclase, and
silica as a function of pressure in the mantle. The far right corresponds to
the lowermost mantle, where these phases are major components. The
kinks in the silica curve result from phase transitions. (Stixrude, 1998.
The Core–Mantle Boundary Region, 83–96, copyright by the American
Geophysical Union.)
face-centered-cubic (fcc) structures. The hcp structure of iron,
aligned along the earth’s rotation axis, does a good job of
modeling the observations.
Inner core anisotropy is also shown by normal modes that
have significant displacement in the inner core. If there were no
lateral heterogeneity or anisotropy, the various singlets making
up a normal mode multiplet would have almost identical
eigenfrequencies (Section 2.9). In fact, as shown in Fig. 3.6-13
for the 18 S 4 multiplet, the modes are split, so the eigenfrequencies for the different singlets (points) vary depending on
the azimuthal order. The solid line (left) shows the splitting
predicted from a transversely isotropic model with elastic
parameters (shown on the right). Here α, β, and γ are combinations of the elastic constants for transverse isotropy (Eqn 5).
The velocity perturbation for any direction through the inner
core is
δv/v = (2β − γ ) cos 2 ξ,
(15)
where ξ is the angle between the ray path and the earth’s rotation axis. δv/v is zero along an equatorial path, but is about 1%
parallel to the axis.
Inner core anisotropy is not perfectly symmetric about the
rotation axis, which allows for the possibility of observing differential rotation of the inner core with respect to the mantle. This
phenomenon has been reported, seen as temporal variations of
the BC-DF residuals (Eqn 14) for similar earthquake-station
geometries. Quantification of such differential rotation and its
implications for the generation of the magnetic field in the convecting outer core are active research areas.
D″ anisotropy beneath the mid-Pacific is variable, with SH
waves usually but not always arriving before the accompanying SV waves. This effect may reflect vertical structures due
to lower-most mantle upwelling. In addition, several mineral
phases that are expected here, such as perovskite (MgSiO 3 ),
periclase (MgO), and the columbite phase of silica (SiO 2 ),
should be anisotropic under these conditions (Fig. 3.6-11). Because little of the core–mantle boundary has been examined for
anisotropy due to the stringent earthquake-station geometries
required, much is yet to be learned.
Significant anisotropy occurs in the solid iron inner core.
PKIKP waves (PKP-DF) travel ~3 s faster in the inner core
along the earth’s rotation axis than along the equatorial plane.
The PKP-DF and PKP-BC phases (Fig. 3.5-7) travel similar
paths through the mantle, so any travel time difference between
them is likely to reflect structure in the core. Because of the
low viscosity of the liquid outer core, flow should eliminate any
lateral velocity variations, including anisotropy. Thus the difference between the observed differential travel times of the BC
and DF phases and that predicted by a model
δt BC − δt DF = (t BC − t DF ) observed − (t BC − t DF ) predicted ,
(14)
is likely to be a function of inner core structure along the DF
path.
Figure 3.6-12 shows BC-DF residuals versus ξ, the angle
between the PKP-DF ray segment in the inner core and the
earth’s spin axis. Small values of ξ correspond to paths parallel
to the spin axis, and the corresponding large residuals indicate
that near-axial PKP-DF waves travel faster and arrive sooner.
Also shown are theoretical predictions for the anisotropic
behavior of solid iron in the hexagonal close-packed (hcp) and