

Anisotropic earth structure 183
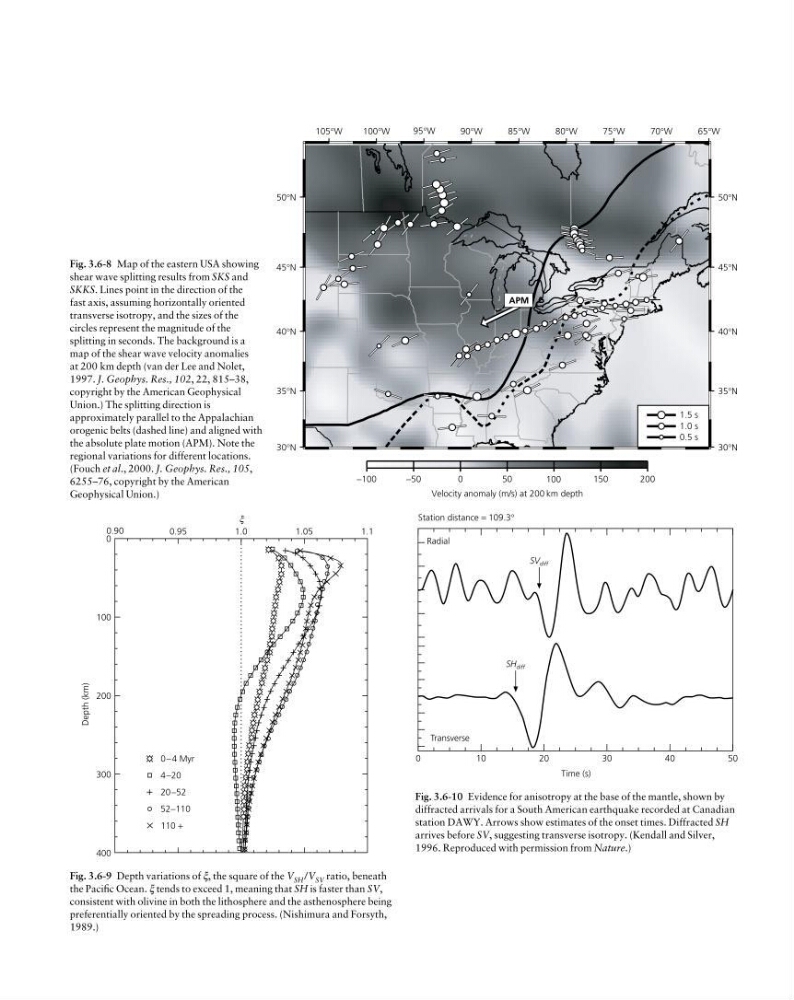
Fig. 3.6-9 Depth variations of ξ, the square of the V SH /V SV ratio, beneath
the Pacific Ocean. ξ tends to exceed 1, meaning that SH is faster than SV,
consistent with olivine in both the lithosphere and the asthenosphere being
preferentially oriented by the spreading process. (Nishimura and Forsyth,
1989.)
−100
−50
0
50
100
150
200
Velocity anomaly (m/s) at 200 km depth
APM
0.5 s
1.0 s
1.5 s
105°W
100°W
95°W
90°W
85°W
80°W
75°W
70°W
65°W
30°N
35°N
40°N
45°N
50°N
30°N
35°N
40°N
45°N
50°N
Fig. 3.6-8 Map of the eastern USA showing
shear wave splitting results from SKS and
SKKS. Lines point in the direction of the
fast axis, assuming horizontally oriented
transverse isotropy, and the sizes of the
circles represent the magnitude of the
splitting in seconds. The background is a
map of the shear wave velocity anomalies
at 200 km depth (van der Lee and Nolet,
1997. J. Geophys. Res., 102, 22, 815–38,
copyright by the American Geophysical
Union.) The splitting direction is
approximately parallel to the Appalachian
orogenic belts (dashed line) and aligned with
the absolute plate motion (APM). Note the
regional variations for different locations.
(Fouch et al., 2000. J. Geophys. Res., 105,
6255–76, copyright by the American
Geophysical Union.)
Depth (km)
0
100
200
300
400
1.0
ξ
0.90
0.95
1.05
1.1
0−4 Myr
4−20
20−52
52−110
110 +
Fig. 3.6-10 Evidence for anisotropy at the base of the mantle, shown by
diffracted arrivals for a South American earthquake recorded at Canadian
station DAWY. Arrows show estimates of the onset times. Diffracted SH
arrives before SV, suggesting transverse isotropy. (Kendall and Silver,
1996. Reproduced with permission from Nature.)
Radial
SV diff
SH diff
Transverse
Station distance = 109.3°
0
1 0
2 0
3 0
4 0
5 0
Time (s)
Fig. 3.6-9 Depth variations of ξ, the square of the V SH /V SV ratio, beneath
the Pacific Ocean. ξ tends to exceed 1, meaning that SH is faster than SV,
consistent with olivine in both the lithosphere and the asthenosphere being
preferentially oriented by the spreading process. (Nishimura and Forsyth,
1989.)
−100
−50
0
50
100
150
200
Velocity anomaly (m/s) at 200 km depth
APM
0.5 s
1.0 s
1.5 s
105°W
100°W
95°W
90°W
85°W
80°W
75°W
70°W
65°W
30°N
35°N
40°N
45°N
50°N
30°N
35°N
40°N
45°N
50°N
Fig. 3.6-8 Map of the eastern USA showing
shear wave splitting results from SKS and
SKKS. Lines point in the direction of the
fast axis, assuming horizontally oriented
transverse isotropy, and the sizes of the
circles represent the magnitude of the
splitting in seconds. The background is a
map of the shear wave velocity anomalies
at 200 km depth (van der Lee and Nolet,
1997. J. Geophys. Res., 102, 22, 815–38,
copyright by the American Geophysical
Union.) The splitting direction is
approximately parallel to the Appalachian
orogenic belts (dashed line) and aligned with
the absolute plate motion (APM). Note the
regional variations for different locations.
(Fouch et al., 2000. J. Geophys. Res., 105,
6255–76, copyright by the American
Geophysical Union.)
Depth (km)
0
100
200
300
400
1.0
ξ
0.90
0.95
1.05
1.1
0−4 Myr
4−20
20−52
52−110
110 +
Fig. 3.6-10 Evidence for anisotropy at the base of the mantle, shown by
diffracted arrivals for a South American earthquake recorded at Canadian
station DAWY. Arrows show estimates of the onset times. Diffracted SH
arrives before SV, suggesting transverse isotropy. (Kendall and Silver,
1996. Reproduced with permission from Nature.)
Radial
SV diff
SH diff
Transverse
Station distance = 109.3°
0
1 0
2 0
3 0
4 0
5 0
Time (s)