

0
200
400
600
800
1000
Velocity (km/s)
T7
(Young
continent)
ARC-TR
(arc-trench)
K8 (shield)
GCA
(ridge)
5
Depth (km)
7
9
11
2200
2300
2400
2500
2600
2700
2800
2900
Depth (km)
v S (km /s)
7.0
PREM
SYL1
SLHE
SLHA
SYLO
SGHE
SWDK
SGLE
SGHP
7.2
7.4
3.5 Body wave travel time studies 173
ScS
Distance (°)
GOL
LHC
SCH
Sbc
S
ScS
Scd
Scd
S
S
ScS
Scd
C M B
80°
TUC
ALQ
SFA
SCP
MNT
OGD
GEO
BLA
ATL
SHA
64
69
74
79
84
501
Time − ∆ × 8.5 (s)
Observed
Synthetics
531
561
591
531
561
591
501
D″
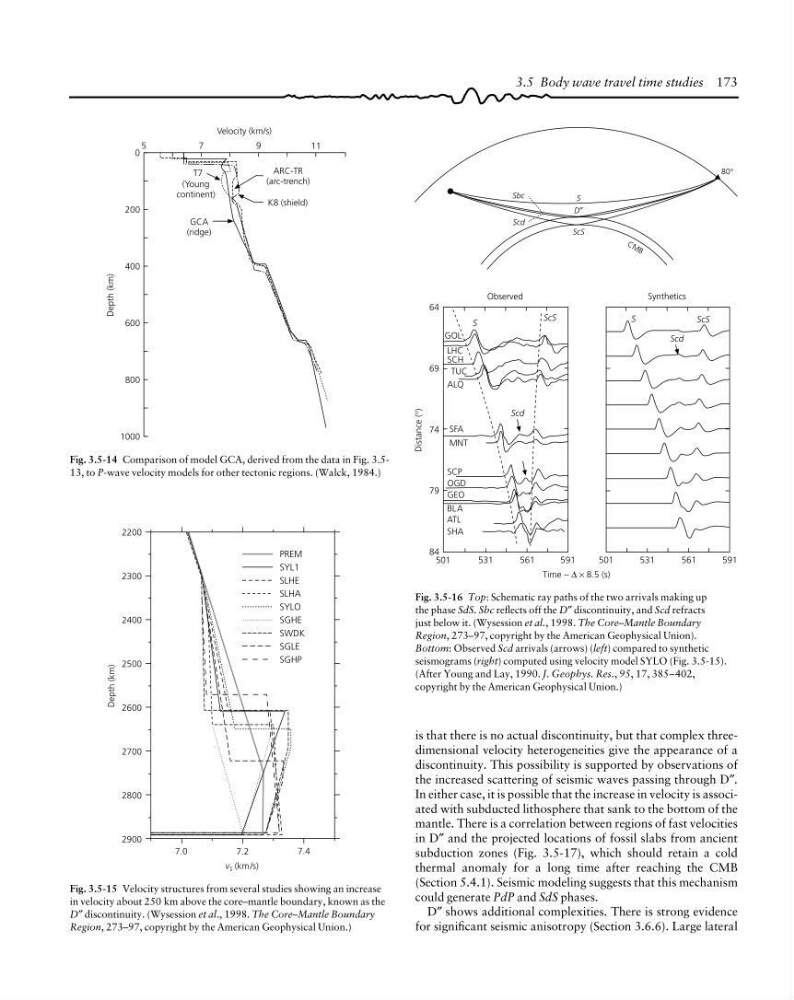
Fig. 3.5-16 Top: Schematic ray paths of the two arrivals making up
the phase SdS. Sbc reflects off the D″ discontinuity, and Scd refracts
just below it. (Wysession et al., 1998. The Core–Mantle Boundary
Region, 273–97, copyright by the American Geophysical Union).
Bottom: Observed Scd arrivals (arrows) (left) compared to synthetic
seismograms (right) computed using velocity model SYLO (Fig. 3.5-15).
(After Young and Lay, 1990. J. Geophys. Res., 95, 17, 385–402,
copyright by the American Geophysical Union.)
is that there is no actual discontinuity, but that complex threedimensional velocity heterogeneities give the appearance of a
discontinuity. This possibility is supported by observations of
the increased scattering of seismic waves passing through D″.
In either case, it is possible that the increase in velocity is associated with subducted lithosphere that sank to the bottom of the
mantle. There is a correlation between regions of fast velocities
in D″ and the projected locations of fossil slabs from ancient
subduction zones (Fig. 3.5-17), which should retain a cold
thermal anomaly for a long time after reaching the CMB
(Section 5.4.1). Seismic modeling suggests that this mechanism
could generate PdP and SdS phases.
D″ shows additional complexities. There is strong evidence
for significant seismic anisotropy (Section 3.6.6). Large lateral
Fig. 3.5-15 Velocity structures from several studies showing an increase
in velocity about 250 km above the core–mantle boundary, known as the
D″ discontinuity. (Wysession et al., 1998. The Core–Mantle Boundary
Region, 273–97, copyright by the American Geophysical Union.)
Fig. 3.5-14 Comparison of model GCA, derived from the data in Fig. 3.513, to P-wave velocity models for other tectonic regions. (Walck, 1984.)
200
400
600
800
1000
Velocity (km/s)
T7
(Young
continent)
ARC-TR
(arc-trench)
K8 (shield)
GCA
(ridge)
5
Depth (km)
7
9
11
2200
2300
2400
2500
2600
2700
2800
2900
Depth (km)
v S (km /s)
7.0
PREM
SYL1
SLHE
SLHA
SYLO
SGHE
SWDK
SGLE
SGHP
7.2
7.4
3.5 Body wave travel time studies 173
ScS
Distance (°)
GOL
LHC
SCH
Sbc
S
ScS
Scd
Scd
S
S
ScS
Scd
C M B
80°
TUC
ALQ
SFA
SCP
MNT
OGD
GEO
BLA
ATL
SHA
64
69
74
79
84
501
Time − ∆ × 8.5 (s)
Observed
Synthetics
531
561
591
531
561
591
501
D″
Fig. 3.5-16 Top: Schematic ray paths of the two arrivals making up
the phase SdS. Sbc reflects off the D″ discontinuity, and Scd refracts
just below it. (Wysession et al., 1998. The Core–Mantle Boundary
Region, 273–97, copyright by the American Geophysical Union).
Bottom: Observed Scd arrivals (arrows) (left) compared to synthetic
seismograms (right) computed using velocity model SYLO (Fig. 3.5-15).
(After Young and Lay, 1990. J. Geophys. Res., 95, 17, 385–402,
copyright by the American Geophysical Union.)
is that there is no actual discontinuity, but that complex threedimensional velocity heterogeneities give the appearance of a
discontinuity. This possibility is supported by observations of
the increased scattering of seismic waves passing through D″.
In either case, it is possible that the increase in velocity is associated with subducted lithosphere that sank to the bottom of the
mantle. There is a correlation between regions of fast velocities
in D″ and the projected locations of fossil slabs from ancient
subduction zones (Fig. 3.5-17), which should retain a cold
thermal anomaly for a long time after reaching the CMB
(Section 5.4.1). Seismic modeling suggests that this mechanism
could generate PdP and SdS phases.
D″ shows additional complexities. There is strong evidence
for significant seismic anisotropy (Section 3.6.6). Large lateral
Fig. 3.5-15 Velocity structures from several studies showing an increase
in velocity about 250 km above the core–mantle boundary, known as the
D″ discontinuity. (Wysession et al., 1998. The Core–Mantle Boundary
Region, 273–97, copyright by the American Geophysical Union.)
Fig. 3.5-14 Comparison of model GCA, derived from the data in Fig. 3.513, to P-wave velocity models for other tectonic regions. (Walck, 1984.)