

2 Introduction
0
5
10
15
P
sP PP/PcP
PcS
sS
SS/ScS
pP
pPP
S
Rayleigh
Time (min)
Earthquake
P wave
S wave
Surface wave
Rayleigh
Receiver
sP
Mantle
Core
PcS
ScS
pP
pPP
PP
S
P
plates making up the earth’s lithosphere, which are the surface expression of convection within earth’s mantle, knowledge of the direction and amount of motion is valuable for
describing plate motions and the forces giving rise to them.
Analysis of seismograms also makes it possible to investigate
the physical processes that occur prior to, during, and after
faulting. Such studies are helpful in assessing the societal
hazards posed by earthquakes.
Our purpose here is to discuss some basic ideas about
seismology and its applications. To do this, we first introduce
several concepts about waves in a solid medium. We will see
that a few simple but powerful ideas give a great deal of insight
into how waves propagate and respond to variations in physical properties in the earth. Fortunately, most of these ideas are
analogous to familiar concepts in the propagation of light
and sound waves. As a result, studying the earth with seismic
waves is conceptually similar to sensing the world around us
using light and sound. For example, you are reading this by
receiving light reflected off the paper. We see color because
light has different wavelengths; the sky is blue because certain
wavelengths are scattered preferentially. An even closer analogy is the use of sound waves by bats, dolphins, and submarines to “see” their surroundings. Seismology gives detailed images of earth structure, much as sound waves (ultrasound) and
electromagnetic waves (X-rays) are used in medicine to study
human bodies.
A familiar property of light is that it bends when traveling between materials in which its speed differs. Objects inserted into
water appear crooked, because light waves travel more slowly
in water than in air. Prisms and lenses use this effect, called refraction. This phenomenon occurs in the earth because seismic
wave velocities generally increase with depth. Wave paths bend
away from the vertical as they go deeper into the earth, eventually become horizontal (“bottom”), turn upward, and return to
the surface (Fig. 1.1-2). The wave paths are thus used to infer
the variation of seismic velocity, and hence the composition
and physical properties of material, with depth in the earth.
Earthquake
Seismic stations
Fig. 1.1-2 Seismic ray paths in the earth, showing the effect of an increase
in seismic velocity with increasing depth. The waves travel in curved paths
between the earthquake and seismic stations.
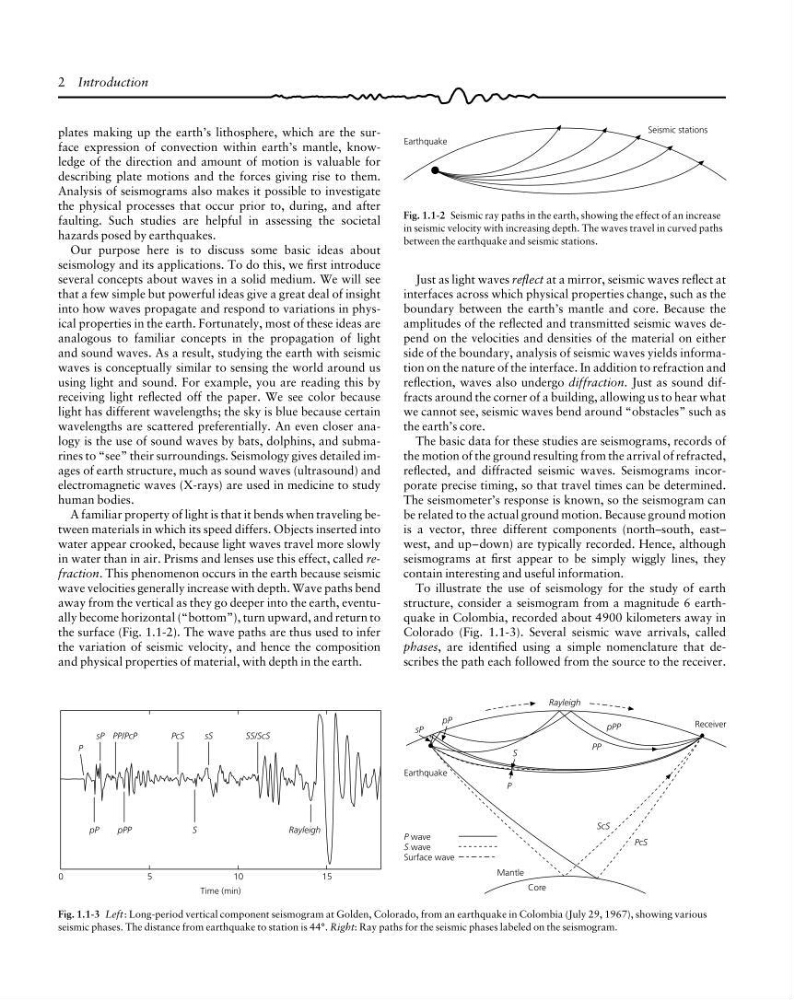
Fig. 1.1-3 Left: Long-period vertical component seismogram at Golden, Colorado, from an earthquake in Colombia (July 29, 1967), showing various
seismic phases. The distance from earthquake to station is 44°. Right: Ray paths for the seismic phases labeled on the seismogram.
Just as light waves reflect at a mirror, seismic waves reflect at
interfaces across which physical properties change, such as the
boundary between the earth’s mantle and core. Because the
amplitudes of the reflected and transmitted seismic waves depend on the velocities and densities of the material on either
side of the boundary, analysis of seismic waves yields information on the nature of the interface. In addition to refraction and
reflection, waves also undergo diffraction. Just as sound diffracts around the corner of a building, allowing us to hear what
we cannot see, seismic waves bend around “obstacles” such as
the earth’s core.
The basic data for these studies are seismograms, records of
the motion of the ground resulting from the arrival of refracted,
reflected, and diffracted seismic waves. Seismograms incorporate precise timing, so that travel times can be determined.
The seismometer’s response is known, so the seismogram can
be related to the actual ground motion. Because ground motion
is a vector, three different components (north–south, east–
west, and up–down) are typically recorded. Hence, although
seismograms at first appear to be simply wiggly lines, they
contain interesting and useful information.
To illustrate the use of seismology for the study of earth
structure, consider a seismogram from a magnitude 6 earthquake in Colombia, recorded about 4900 kilometers away in
Colorado (Fig. 1.1-3). Several seismic wave arrivals, called
phases, are identified using a simple nomenclature that describes the path each followed from the source to the receiver.
0
5
10
15
P
sP PP/PcP
PcS
sS
SS/ScS
pP
pPP
S
Rayleigh
Time (min)
Earthquake
P wave
S wave
Surface wave
Rayleigh
Receiver
sP
Mantle
Core
PcS
ScS
pP
pPP
PP
S
P
plates making up the earth’s lithosphere, which are the surface expression of convection within earth’s mantle, knowledge of the direction and amount of motion is valuable for
describing plate motions and the forces giving rise to them.
Analysis of seismograms also makes it possible to investigate
the physical processes that occur prior to, during, and after
faulting. Such studies are helpful in assessing the societal
hazards posed by earthquakes.
Our purpose here is to discuss some basic ideas about
seismology and its applications. To do this, we first introduce
several concepts about waves in a solid medium. We will see
that a few simple but powerful ideas give a great deal of insight
into how waves propagate and respond to variations in physical properties in the earth. Fortunately, most of these ideas are
analogous to familiar concepts in the propagation of light
and sound waves. As a result, studying the earth with seismic
waves is conceptually similar to sensing the world around us
using light and sound. For example, you are reading this by
receiving light reflected off the paper. We see color because
light has different wavelengths; the sky is blue because certain
wavelengths are scattered preferentially. An even closer analogy is the use of sound waves by bats, dolphins, and submarines to “see” their surroundings. Seismology gives detailed images of earth structure, much as sound waves (ultrasound) and
electromagnetic waves (X-rays) are used in medicine to study
human bodies.
A familiar property of light is that it bends when traveling between materials in which its speed differs. Objects inserted into
water appear crooked, because light waves travel more slowly
in water than in air. Prisms and lenses use this effect, called refraction. This phenomenon occurs in the earth because seismic
wave velocities generally increase with depth. Wave paths bend
away from the vertical as they go deeper into the earth, eventually become horizontal (“bottom”), turn upward, and return to
the surface (Fig. 1.1-2). The wave paths are thus used to infer
the variation of seismic velocity, and hence the composition
and physical properties of material, with depth in the earth.
Earthquake
Seismic stations
Fig. 1.1-2 Seismic ray paths in the earth, showing the effect of an increase
in seismic velocity with increasing depth. The waves travel in curved paths
between the earthquake and seismic stations.
Fig. 1.1-3 Left: Long-period vertical component seismogram at Golden, Colorado, from an earthquake in Colombia (July 29, 1967), showing various
seismic phases. The distance from earthquake to station is 44°. Right: Ray paths for the seismic phases labeled on the seismogram.
Just as light waves reflect at a mirror, seismic waves reflect at
interfaces across which physical properties change, such as the
boundary between the earth’s mantle and core. Because the
amplitudes of the reflected and transmitted seismic waves depend on the velocities and densities of the material on either
side of the boundary, analysis of seismic waves yields information on the nature of the interface. In addition to refraction and
reflection, waves also undergo diffraction. Just as sound diffracts around the corner of a building, allowing us to hear what
we cannot see, seismic waves bend around “obstacles” such as
the earth’s core.
The basic data for these studies are seismograms, records of
the motion of the ground resulting from the arrival of refracted,
reflected, and diffracted seismic waves. Seismograms incorporate precise timing, so that travel times can be determined.
The seismometer’s response is known, so the seismogram can
be related to the actual ground motion. Because ground motion
is a vector, three different components (north–south, east–
west, and up–down) are typically recorded. Hence, although
seismograms at first appear to be simply wiggly lines, they
contain interesting and useful information.
To illustrate the use of seismology for the study of earth
structure, consider a seismogram from a magnitude 6 earthquake in Colombia, recorded about 4900 kilometers away in
Colorado (Fig. 1.1-3). Several seismic wave arrivals, called
phases, are identified using a simple nomenclature that describes the path each followed from the source to the receiver.