

3.3 Reflection seismology 149
6 Vibroseis is a trademark of the Continental Oil Company. The first such continuously operating variable frequency seismic source was invented by Selwyn Sacks in his
Ph.D. thesis in 1961.
from expansion and contraction of the air bubble that the gun
injects into the water. The signal can be sharpened using multiple air guns offset in time, which interfere to give a sharper
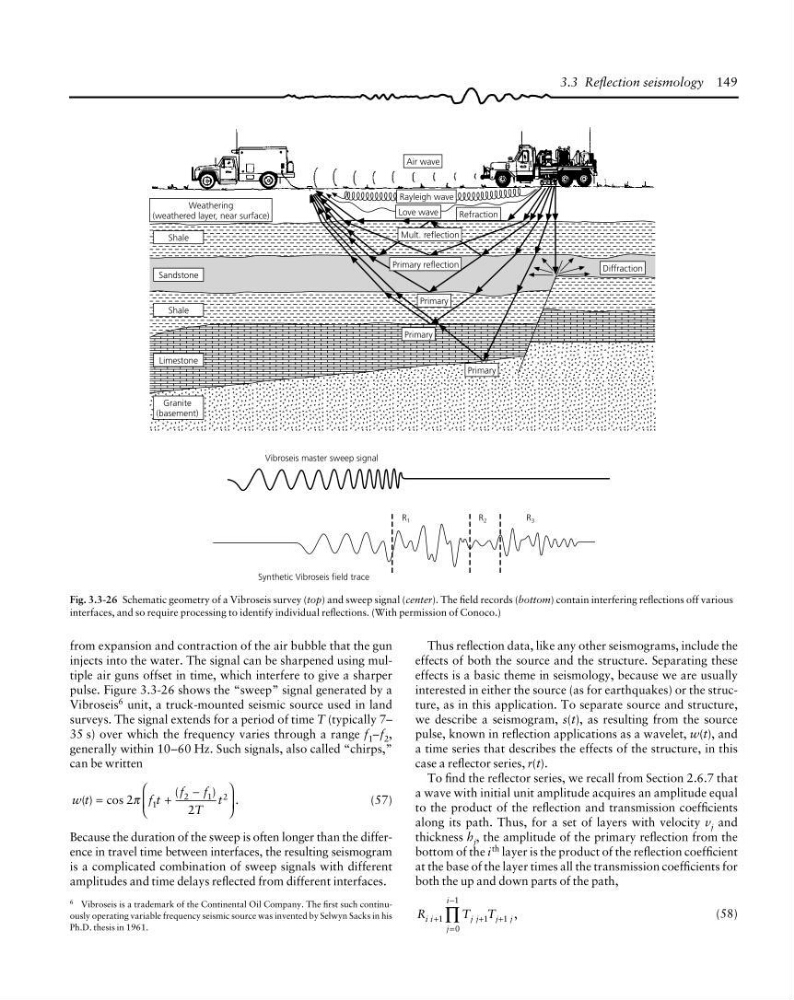
pulse. Figure 3.3-26 shows the “sweep” signal generated by a
Vibroseis 6 unit, a truck-mounted seismic source used in land
surveys. The signal extends for a period of time T (typically 7–
35 s) over which the frequency varies through a range f 1 –f 2 ,
generally within 10–60 Hz. Such signals, also called “chirps,”
can be written
w t
f t
f
f
T
t
( ) cos
(
)
.
=
+
−
⎛
⎝
⎜
⎞
⎠
⎟
2
2
1
2
1 2
π
(57)
Because the duration of the sweep is often longer than the difference in travel time between interfaces, the resulting seismogram
is a complicated combination of sweep signals with different
amplitudes and time delays reflected from different interfaces.
Thus reflection data, like any other seismograms, include the
effects of both the source and the structure. Separating these
effects is a basic theme in seismology, because we are usually
interested in either the source (as for earthquakes) or the structure, as in this application. To separate source and structure,
we describe a seismogram, s(t), as resulting from the source
pulse, known in reflection applications as a wavelet, w(t), and
a time series that describes the effects of the structure, in this
case a reflector series, r(t).
To find the reflector series, we recall from Section 2.6.7 that
a wave with initial unit amplitude acquires an amplitude equal
to the product of the reflection and transmission coefficients
along its path. Thus, for a set of layers with velocity v j and
thickness h j , the amplitude of the primary reflection from the
bottom of the i th layer is the product of the reflection coefficient
at the base of the layer times all the transmission coefficients for
both the up and down parts of the path,
R
T T
i i
j j
j j
j
i
,
+
+
+
=
−
∏
1
1
1
0
1
(58)
Fig. 3.3-26 Schematic geometry of a Vibroseis survey (top) and sweep signal (center). The field records (bottom) contain interfering reflections off various
interfaces, and so require processing to identify individual reflections. (With permission of Conoco.)
Weathering
(weathered layer, near surface)
Vibroseis master sweep signal
Synthetic Vibroseis field trace
Primary reflection
Air wave
Love wave
Rayleigh wave
Refraction
Diffraction
R 1
R 2
R 3
Granite
(basement)
Limestone
Primary
Primary
Primary
Shale
Sandstone
Shale
Mult. reflection
6 Vibroseis is a trademark of the Continental Oil Company. The first such continuously operating variable frequency seismic source was invented by Selwyn Sacks in his
Ph.D. thesis in 1961.
from expansion and contraction of the air bubble that the gun
injects into the water. The signal can be sharpened using multiple air guns offset in time, which interfere to give a sharper
pulse. Figure 3.3-26 shows the “sweep” signal generated by a
Vibroseis 6 unit, a truck-mounted seismic source used in land
surveys. The signal extends for a period of time T (typically 7–
35 s) over which the frequency varies through a range f 1 –f 2 ,
generally within 10–60 Hz. Such signals, also called “chirps,”
can be written
w t
f t
f
f
T
t
( ) cos
(
)
.
=
+
−
⎛
⎝
⎜
⎞
⎠
⎟
2
2
1
2
1 2
π
(57)
Because the duration of the sweep is often longer than the difference in travel time between interfaces, the resulting seismogram
is a complicated combination of sweep signals with different
amplitudes and time delays reflected from different interfaces.
Thus reflection data, like any other seismograms, include the
effects of both the source and the structure. Separating these
effects is a basic theme in seismology, because we are usually
interested in either the source (as for earthquakes) or the structure, as in this application. To separate source and structure,
we describe a seismogram, s(t), as resulting from the source
pulse, known in reflection applications as a wavelet, w(t), and
a time series that describes the effects of the structure, in this
case a reflector series, r(t).
To find the reflector series, we recall from Section 2.6.7 that
a wave with initial unit amplitude acquires an amplitude equal
to the product of the reflection and transmission coefficients
along its path. Thus, for a set of layers with velocity v j and
thickness h j , the amplitude of the primary reflection from the
bottom of the i th layer is the product of the reflection coefficient
at the base of the layer times all the transmission coefficients for
both the up and down parts of the path,
R
T T
i i
j j
j j
j
i
,
+
+
+
=
−
∏
1
1
1
0
1
(58)
Fig. 3.3-26 Schematic geometry of a Vibroseis survey (top) and sweep signal (center). The field records (bottom) contain interfering reflections off various
interfaces, and so require processing to identify individual reflections. (With permission of Conoco.)
Weathering
(weathered layer, near surface)
Vibroseis master sweep signal
Synthetic Vibroseis field trace
Primary reflection
Air wave
Love wave
Rayleigh wave
Refraction
Diffraction
R 1
R 2
R 3
Granite
(basement)
Limestone
Primary
Primary
Primary
Shale
Sandstone
Shale
Mult. reflection