

130 Seismology and Earth Structure
10
20
30
Depth (km)
4
6
8
km/s
5.7
5.5?
7.2
8.0
10
20
30
4
6
8
6.1
5.5?
8.0
10
20
30
4
6
8
5.7
5.5?
6.8
8.0
10
20
30
4
6
8
7.3
8.0
10
20
30
40
4
6
8
10
20
30
40
4
6
8
6.6
6.1
7.0
6.8
6.2
6.6
7.8
6.2
7.9
0
20
40
0
20
40
0
100
200
300
400
500
600
700
800 km
Great
Basin
Sierra
Nevada
Great
Valley
SAF
Coast
ranges
Coast
Pacific
Ocean
E
W
M
(2 × 1)
Sedimentary rocks; K,T
Granitic rocks; J,K
Intermediate intrusive rocks; J,K
Franciscan-type marine
metasedimentary and
metavolcanic rocks; M Z , C Z
Intermediate and mafic
intrusive mylonitized
rocks; P Z , M Z
Gabbro and associated mafic
crystalline rocks; M Z , C Z
Undifferentiated metamorphic
rock, refers to Sierra Nevadan
foothills Belt-type rocks beneath
Great Valley; PC, P Z , M Z
Felsic to intermediate
volcanic flows and intrusive
equivalents; C Z
Great Valley Sequence
metasedimentary rocks;
J,K, Paleogene
layer, it is better to view it as a zone where velocities increase
rapidly with depth to values above about 7.7 km/s.
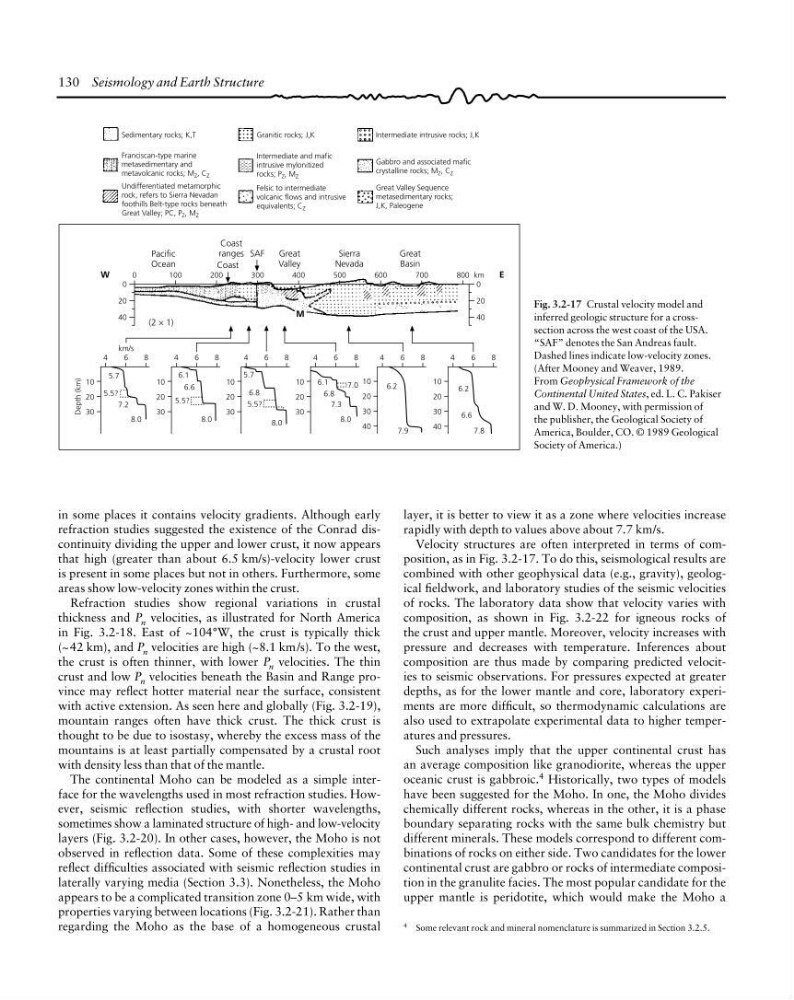
Velocity structures are often interpreted in terms of composition, as in Fig. 3.2-17. To do this, seismological results are
combined with other geophysical data (e.g., gravity), geological fieldwork, and laboratory studies of the seismic velocities
of rocks. The laboratory data show that velocity varies with
composition, as shown in Fig. 3.2-22 for igneous rocks of
the crust and upper mantle. Moreover, velocity increases with
pressure and decreases with temperature. Inferences about
composition are thus made by comparing predicted velocities to seismic observations. For pressures expected at greater
depths, as for the lower mantle and core, laboratory experiments are more difficult, so thermodynamic calculations are
also used to extrapolate experimental data to higher temperatures and pressures.
Such analyses imply that the upper continental crust has
an average composition like granodiorite, whereas the upper
oceanic crust is gabbroic. 4 Historically, two types of models
have been suggested for the Moho. In one, the Moho divides
chemically different rocks, whereas in the other, it is a phase
boundary separating rocks with the same bulk chemistry but
different minerals. These models correspond to different combinations of rocks on either side. Two candidates for the lower
continental crust are gabbro or rocks of intermediate composition in the granulite facies. The most popular candidate for the
upper mantle is peridotite, which would make the Moho a
in some places it contains velocity gradients. Although early
refraction studies suggested the existence of the Conrad discontinuity dividing the upper and lower crust, it now appears
that high (greater than about 6.5 km/s)-velocity lower crust
is present in some places but not in others. Furthermore, some
areas show low-velocity zones within the crust.
Refraction studies show regional variations in crustal
thickness and P n velocities, as illustrated for North America
in Fig. 3.2-18. East of ~104°W, the crust is typically thick
(~42 km), and P n velocities are high (~8.1 km/s). To the west,
the crust is often thinner, with lower P n velocities. The thin
crust and low P n velocities beneath the Basin and Range province may reflect hotter material near the surface, consistent
with active extension. As seen here and globally (Fig. 3.2-19),
mountain ranges often have thick crust. The thick crust is
thought to be due to isostasy, whereby the excess mass of the
mountains is at least partially compensated by a crustal root
with density less than that of the mantle.
The continental Moho can be modeled as a simple interface for the wavelengths used in most refraction studies. However, seismic reflection studies, with shorter wavelengths,
sometimes show a laminated structure of high- and low-velocity
layers (Fig. 3.2-20). In other cases, however, the Moho is not
observed in reflection data. Some of these complexities may
reflect difficulties associated with seismic reflection studies in
laterally varying media (Section 3.3). Nonetheless, the Moho
appears to be a complicated transition zone 0–5 km wide, with
properties varying between locations (Fig. 3.2-21). Rather than
regarding the Moho as the base of a homogeneous crustal
4 Some relevant rock and mineral nomenclature is summarized in Section 3.2.5.
Fig. 3.2-17 Crustal velocity model and
inferred geologic structure for a crosssection across the west coast of the USA.
“SAF” denotes the San Andreas fault.
Dashed lines indicate low-velocity zones.
(After Mooney and Weaver, 1989.
From Geophysical Framework of the
Continental United States, ed. L. C. Pakiser
and W. D. Mooney, with permission of
the publisher, the Geological Society of
America, Boulder, CO. © 1989 Geological
Society of America.)
10
20
30
Depth (km)
4
6
8
km/s
5.7
5.5?
7.2
8.0
10
20
30
4
6
8
6.1
5.5?
8.0
10
20
30
4
6
8
5.7
5.5?
6.8
8.0
10
20
30
4
6
8
7.3
8.0
10
20
30
40
4
6
8
10
20
30
40
4
6
8
6.6
6.1
7.0
6.8
6.2
6.6
7.8
6.2
7.9
0
20
40
0
20
40
0
100
200
300
400
500
600
700
800 km
Great
Basin
Sierra
Nevada
Great
Valley
SAF
Coast
ranges
Coast
Pacific
Ocean
E
W
M
(2 × 1)
Sedimentary rocks; K,T
Granitic rocks; J,K
Intermediate intrusive rocks; J,K
Franciscan-type marine
metasedimentary and
metavolcanic rocks; M Z , C Z
Intermediate and mafic
intrusive mylonitized
rocks; P Z , M Z
Gabbro and associated mafic
crystalline rocks; M Z , C Z
Undifferentiated metamorphic
rock, refers to Sierra Nevadan
foothills Belt-type rocks beneath
Great Valley; PC, P Z , M Z
Felsic to intermediate
volcanic flows and intrusive
equivalents; C Z
Great Valley Sequence
metasedimentary rocks;
J,K, Paleogene
layer, it is better to view it as a zone where velocities increase
rapidly with depth to values above about 7.7 km/s.
Velocity structures are often interpreted in terms of composition, as in Fig. 3.2-17. To do this, seismological results are
combined with other geophysical data (e.g., gravity), geological fieldwork, and laboratory studies of the seismic velocities
of rocks. The laboratory data show that velocity varies with
composition, as shown in Fig. 3.2-22 for igneous rocks of
the crust and upper mantle. Moreover, velocity increases with
pressure and decreases with temperature. Inferences about
composition are thus made by comparing predicted velocities to seismic observations. For pressures expected at greater
depths, as for the lower mantle and core, laboratory experiments are more difficult, so thermodynamic calculations are
also used to extrapolate experimental data to higher temperatures and pressures.
Such analyses imply that the upper continental crust has
an average composition like granodiorite, whereas the upper
oceanic crust is gabbroic. 4 Historically, two types of models
have been suggested for the Moho. In one, the Moho divides
chemically different rocks, whereas in the other, it is a phase
boundary separating rocks with the same bulk chemistry but
different minerals. These models correspond to different combinations of rocks on either side. Two candidates for the lower
continental crust are gabbro or rocks of intermediate composition in the granulite facies. The most popular candidate for the
upper mantle is peridotite, which would make the Moho a
in some places it contains velocity gradients. Although early
refraction studies suggested the existence of the Conrad discontinuity dividing the upper and lower crust, it now appears
that high (greater than about 6.5 km/s)-velocity lower crust
is present in some places but not in others. Furthermore, some
areas show low-velocity zones within the crust.
Refraction studies show regional variations in crustal
thickness and P n velocities, as illustrated for North America
in Fig. 3.2-18. East of ~104°W, the crust is typically thick
(~42 km), and P n velocities are high (~8.1 km/s). To the west,
the crust is often thinner, with lower P n velocities. The thin
crust and low P n velocities beneath the Basin and Range province may reflect hotter material near the surface, consistent
with active extension. As seen here and globally (Fig. 3.2-19),
mountain ranges often have thick crust. The thick crust is
thought to be due to isostasy, whereby the excess mass of the
mountains is at least partially compensated by a crustal root
with density less than that of the mantle.
The continental Moho can be modeled as a simple interface for the wavelengths used in most refraction studies. However, seismic reflection studies, with shorter wavelengths,
sometimes show a laminated structure of high- and low-velocity
layers (Fig. 3.2-20). In other cases, however, the Moho is not
observed in reflection data. Some of these complexities may
reflect difficulties associated with seismic reflection studies in
laterally varying media (Section 3.3). Nonetheless, the Moho
appears to be a complicated transition zone 0–5 km wide, with
properties varying between locations (Fig. 3.2-21). Rather than
regarding the Moho as the base of a homogeneous crustal
4 Some relevant rock and mineral nomenclature is summarized in Section 3.2.5.
Fig. 3.2-17 Crustal velocity model and
inferred geologic structure for a crosssection across the west coast of the USA.
“SAF” denotes the San Andreas fault.
Dashed lines indicate low-velocity zones.
(After Mooney and Weaver, 1989.
From Geophysical Framework of the
Continental United States, ed. L. C. Pakiser
and W. D. Mooney, with permission of
the publisher, the Geological Society of
America, Boulder, CO. © 1989 Geological
Society of America.)