

3.2 Refraction seismology 129
at sea. In some cases, disposable sonobuoys or retrievable
ocean bottom seismometers are deployed, and a ship steams
away firing “shots.” In other cases, two ships are used. Marine
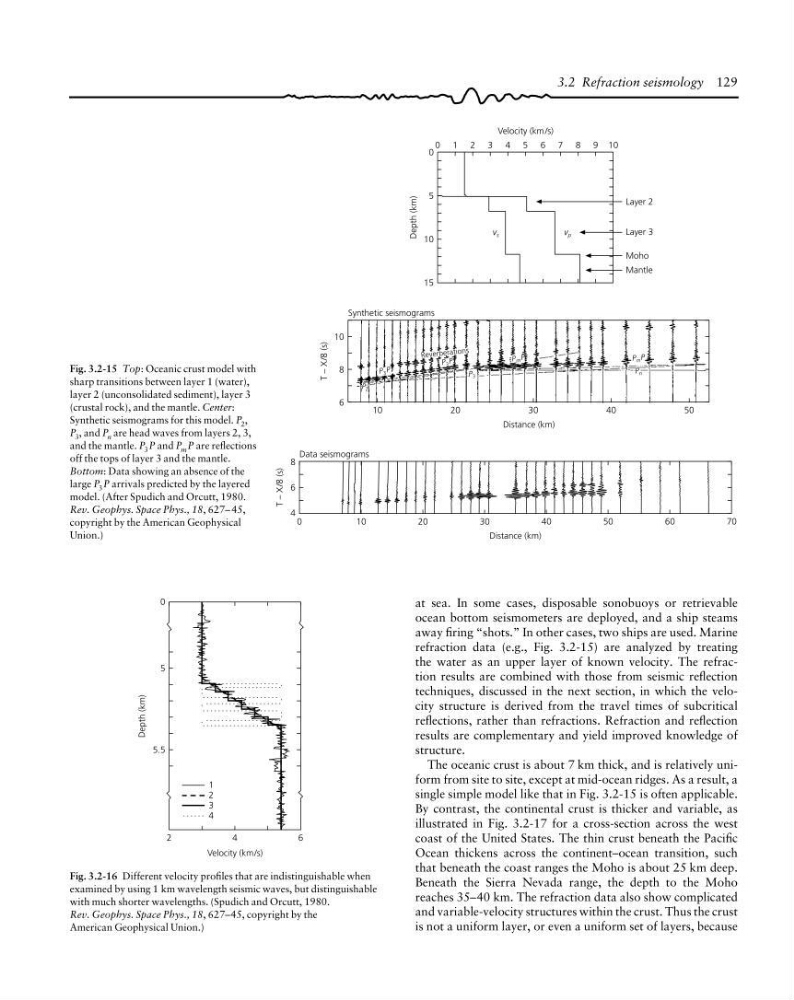
refraction data (e.g., Fig. 3.2-15) are analyzed by treating
the water as an upper layer of known velocity. The refraction results are combined with those from seismic reflection
techniques, discussed in the next section, in which the velocity structure is derived from the travel times of subcritical
reflections, rather than refractions. Refraction and reflection
results are complementary and yield improved knowledge of
structure.
The oceanic crust is about 7 km thick, and is relatively uniform from site to site, except at mid-ocean ridges. As a result, a
single simple model like that in Fig. 3.2-15 is often applicable.
By contrast, the continental crust is thicker and variable, as
illustrated in Fig. 3.2-17 for a cross-section across the west
coast of the United States. The thin crust beneath the Pacific
Ocean thickens across the continent–ocean transition, such
that beneath the coast ranges the Moho is about 25 km deep.
Beneath the Sierra Nevada range, the depth to the Moho
reaches 35–40 km. The refraction data also show complicated
and variable-velocity structures within the crust. Thus the crust
is not a uniform layer, or even a uniform set of layers, because
Fig. 3.2-16 Different velocity profiles that are indistinguishable when
examined by using 1 km wavelength seismic waves, but distinguishable
with much shorter wavelengths. (Spudich and Orcutt, 1980.
Rev. Geophys. Space Phys., 18, 627–45, copyright by the
American Geophysical Union.)
Depth (km)
0
2
Velocity (km/s)
5
5.5
1
2
3
4
4
6
T – X/8 (s)
8
6
4
70
0
10
20
30
40
50
60
Distance (km)
0 1 2 3 4 5 6 7 8 9 10
0
5
10
15
Layer 2
Layer 3
Moho
Mantle
v s
v p
Depth (km)
Velocity (km /s)
10
20
30
40
50
Distance (km)
T – X/8 (s)
10
8
6
Synthetic seismograms
Data seismograms
Reve rber atio ns
P 3 P
P 3 P
P m P
P m P
P 2
P 3
P n
Fig. 3.2-15 Top: Oceanic crust model with
sharp transitions between layer 1 (water),
layer 2 (unconsolidated sediment), layer 3
(crustal rock), and the mantle. Center:
Synthetic seismograms for this model. P 2 ,
P 3 , and P n are head waves from layers 2, 3,
and the mantle. P 3 P and P m P are reflections
off the tops of layer 3 and the mantle.
Bottom: Data showing an absence of the
large P 3 P arrivals predicted by the layered
model. (After Spudich and Orcutt, 1980.
Rev. Geophys. Space Phys., 18, 627– 45,
copyright by the American Geophysical
Union.)
at sea. In some cases, disposable sonobuoys or retrievable
ocean bottom seismometers are deployed, and a ship steams
away firing “shots.” In other cases, two ships are used. Marine
refraction data (e.g., Fig. 3.2-15) are analyzed by treating
the water as an upper layer of known velocity. The refraction results are combined with those from seismic reflection
techniques, discussed in the next section, in which the velocity structure is derived from the travel times of subcritical
reflections, rather than refractions. Refraction and reflection
results are complementary and yield improved knowledge of
structure.
The oceanic crust is about 7 km thick, and is relatively uniform from site to site, except at mid-ocean ridges. As a result, a
single simple model like that in Fig. 3.2-15 is often applicable.
By contrast, the continental crust is thicker and variable, as
illustrated in Fig. 3.2-17 for a cross-section across the west
coast of the United States. The thin crust beneath the Pacific
Ocean thickens across the continent–ocean transition, such
that beneath the coast ranges the Moho is about 25 km deep.
Beneath the Sierra Nevada range, the depth to the Moho
reaches 35–40 km. The refraction data also show complicated
and variable-velocity structures within the crust. Thus the crust
is not a uniform layer, or even a uniform set of layers, because
Fig. 3.2-16 Different velocity profiles that are indistinguishable when
examined by using 1 km wavelength seismic waves, but distinguishable
with much shorter wavelengths. (Spudich and Orcutt, 1980.
Rev. Geophys. Space Phys., 18, 627–45, copyright by the
American Geophysical Union.)
Depth (km)
0
2
Velocity (km/s)
5
5.5
1
2
3
4
4
6
T – X/8 (s)
8
6
4
70
0
10
20
30
40
50
60
Distance (km)
0 1 2 3 4 5 6 7 8 9 10
0
5
10
15
Layer 2
Layer 3
Moho
Mantle
v s
v p
Depth (km)
Velocity (km /s)
10
20
30
40
50
Distance (km)
T – X/8 (s)
10
8
6
Synthetic seismograms
Data seismograms
Reve rber atio ns
P 3 P
P 3 P
P m P
P m P
P 2
P 3
P n
Fig. 3.2-15 Top: Oceanic crust model with
sharp transitions between layer 1 (water),
layer 2 (unconsolidated sediment), layer 3
(crustal rock), and the mantle. Center:
Synthetic seismograms for this model. P 2 ,
P 3 , and P n are head waves from layers 2, 3,
and the mantle. P 3 P and P m P are reflections
off the tops of layer 3 and the mantle.
Bottom: Data showing an absence of the
large P 3 P arrivals predicted by the layered
model. (After Spudich and Orcutt, 1980.
Rev. Geophys. Space Phys., 18, 627– 45,
copyright by the American Geophysical
Union.)