

128 Seismology and Earth Structure
7 .0
8.0
9 .0
1 0 . 0
Gradual Moho
Reduced travel time
(T
− X/8.0 s)
7.5
7.0
6.5
6.0
5.5
5.0
Discontinuous Moho
P m P
Velocity
6 . 0
1 2 . 0
P-velocity (km/s)
2. 4. 6. 8.
0.
10.
20.
30.
Depth (km)
P m P
P n
Reduced travel time
(T
− X/8.0 s)
7.0
6.5
6.0
5.5
5.0
4.5
0
50
100
150
0
50
100
150
P-velocity (km/s)
2. 4. 6. 8.
0.
10.
20.
30.
40.
Depth (km)
Velocity
6 . 0
7 .0
8.0
9 .0
1
0
.
0
1
2
.
0
P m P
P n
P m P
Distance (km)
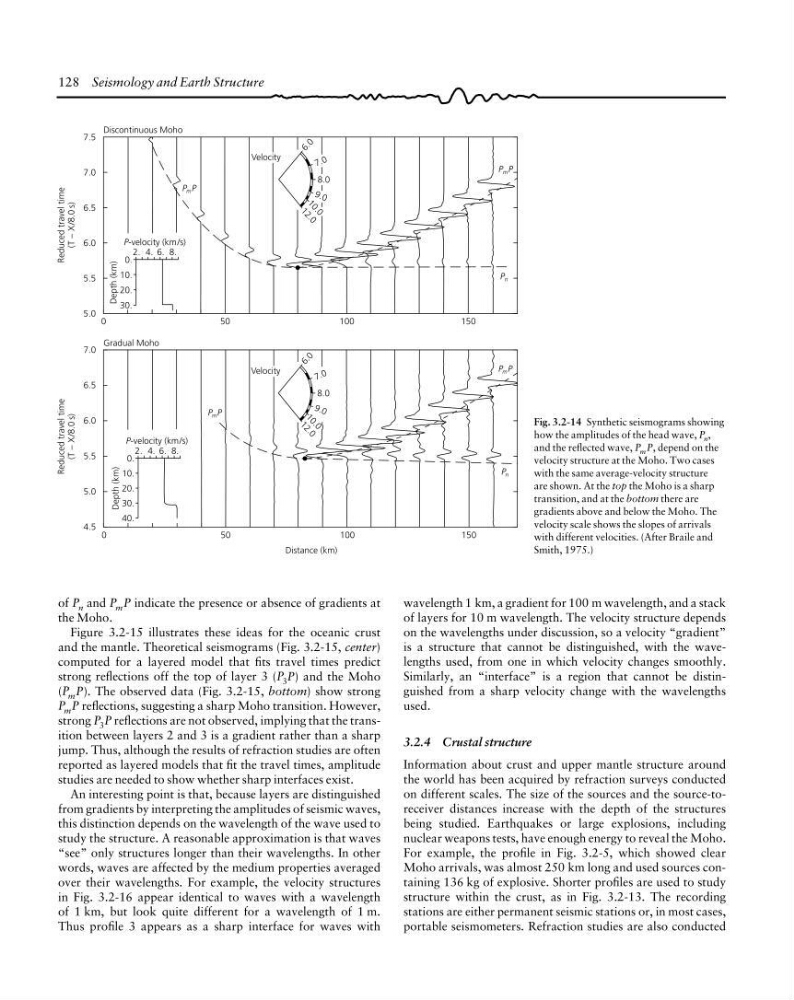
of P n and P m P indicate the presence or absence of gradients at
the Moho.
Figure 3.2-15 illustrates these ideas for the oceanic crust
and the mantle. Theoretical seismograms (Fig. 3.2-15, center)
computed for a layered model that fits travel times predict
strong reflections off the top of layer 3 (P 3 P) and the Moho
(P m P). The observed data (Fig. 3.2-15, bottom) show strong
P m P reflections, suggesting a sharp Moho transition. However,
strong P 3 P reflections are not observed, implying that the transition between layers 2 and 3 is a gradient rather than a sharp
jump. Thus, although the results of refraction studies are often
reported as layered models that fit the travel times, amplitude
studies are needed to show whether sharp interfaces exist.
An interesting point is that, because layers are distinguished
from gradients by interpreting the amplitudes of seismic waves,
this distinction depends on the wavelength of the wave used to
study the structure. A reasonable approximation is that waves
“see” only structures longer than their wavelengths. In other
words, waves are affected by the medium properties averaged
over their wavelengths. For example, the velocity structures
in Fig. 3.2-16 appear identical to waves with a wavelength
of 1 km, but look quite different for a wavelength of 1 m.
Thus profile 3 appears as a sharp interface for waves with
wavelength 1 km, a gradient for 100 m wavelength, and a stack
of layers for 10 m wavelength. The velocity structure depends
on the wavelengths under discussion, so a velocity “gradient”
is a structure that cannot be distinguished, with the wavelengths used, from one in which velocity changes smoothly.
Similarly, an “interface” is a region that cannot be distinguished from a sharp velocity change with the wavelengths
used.
3.2.4 Crustal structure
Information about crust and upper mantle structure around
the world has been acquired by refraction surveys conducted
on different scales. The size of the sources and the source-toreceiver distances increase with the depth of the structures
being studied. Earthquakes or large explosions, including
nuclear weapons tests, have enough energy to reveal the Moho.
For example, the profile in Fig. 3.2-5, which showed clear
Moho arrivals, was almost 250 km long and used sources containing 136 kg of explosive. Shorter profiles are used to study
structure within the crust, as in Fig. 3.2-13. The recording
stations are either permanent seismic stations or, in most cases,
portable seismometers. Refraction studies are also conducted
Fig. 3.2-14 Synthetic seismograms showing
how the amplitudes of the head wave, P n ,
and the reflected wave, P m P, depend on the
velocity structure at the Moho. Two cases
with the same average-velocity structure
are shown. At the top the Moho is a sharp
transition, and at the bottom there are
gradients above and below the Moho. The
velocity scale shows the slopes of arrivals
with different velocities. (After Braile and
Smith, 1975.)
7 .0
8.0
9 .0
1 0 . 0
Gradual Moho
Reduced travel time
(T
− X/8.0 s)
7.5
7.0
6.5
6.0
5.5
5.0
Discontinuous Moho
P m P
Velocity
6 . 0
1 2 . 0
P-velocity (km/s)
2. 4. 6. 8.
0.
10.
20.
30.
Depth (km)
P m P
P n
Reduced travel time
(T
− X/8.0 s)
7.0
6.5
6.0
5.5
5.0
4.5
0
50
100
150
0
50
100
150
P-velocity (km/s)
2. 4. 6. 8.
0.
10.
20.
30.
40.
Depth (km)
Velocity
6 . 0
7 .0
8.0
9 .0
1
0
.
0
1
2
.
0
P m P
P n
P m P
Distance (km)
of P n and P m P indicate the presence or absence of gradients at
the Moho.
Figure 3.2-15 illustrates these ideas for the oceanic crust
and the mantle. Theoretical seismograms (Fig. 3.2-15, center)
computed for a layered model that fits travel times predict
strong reflections off the top of layer 3 (P 3 P) and the Moho
(P m P). The observed data (Fig. 3.2-15, bottom) show strong
P m P reflections, suggesting a sharp Moho transition. However,
strong P 3 P reflections are not observed, implying that the transition between layers 2 and 3 is a gradient rather than a sharp
jump. Thus, although the results of refraction studies are often
reported as layered models that fit the travel times, amplitude
studies are needed to show whether sharp interfaces exist.
An interesting point is that, because layers are distinguished
from gradients by interpreting the amplitudes of seismic waves,
this distinction depends on the wavelength of the wave used to
study the structure. A reasonable approximation is that waves
“see” only structures longer than their wavelengths. In other
words, waves are affected by the medium properties averaged
over their wavelengths. For example, the velocity structures
in Fig. 3.2-16 appear identical to waves with a wavelength
of 1 km, but look quite different for a wavelength of 1 m.
Thus profile 3 appears as a sharp interface for waves with
wavelength 1 km, a gradient for 100 m wavelength, and a stack
of layers for 10 m wavelength. The velocity structure depends
on the wavelengths under discussion, so a velocity “gradient”
is a structure that cannot be distinguished, with the wavelengths used, from one in which velocity changes smoothly.
Similarly, an “interface” is a region that cannot be distinguished from a sharp velocity change with the wavelengths
used.
3.2.4 Crustal structure
Information about crust and upper mantle structure around
the world has been acquired by refraction surveys conducted
on different scales. The size of the sources and the source-toreceiver distances increase with the depth of the structures
being studied. Earthquakes or large explosions, including
nuclear weapons tests, have enough energy to reveal the Moho.
For example, the profile in Fig. 3.2-5, which showed clear
Moho arrivals, was almost 250 km long and used sources containing 136 kg of explosive. Shorter profiles are used to study
structure within the crust, as in Fig. 3.2-13. The recording
stations are either permanent seismic stations or, in most cases,
portable seismometers. Refraction studies are also conducted
Fig. 3.2-14 Synthetic seismograms showing
how the amplitudes of the head wave, P n ,
and the reflected wave, P m P, depend on the
velocity structure at the Moho. Two cases
with the same average-velocity structure
are shown. At the top the Moho is a sharp
transition, and at the bottom there are
gradients above and below the Moho. The
velocity scale shows the slopes of arrivals
with different velocities. (After Braile and
Smith, 1975.)