

126 Seismology and Earth Structure
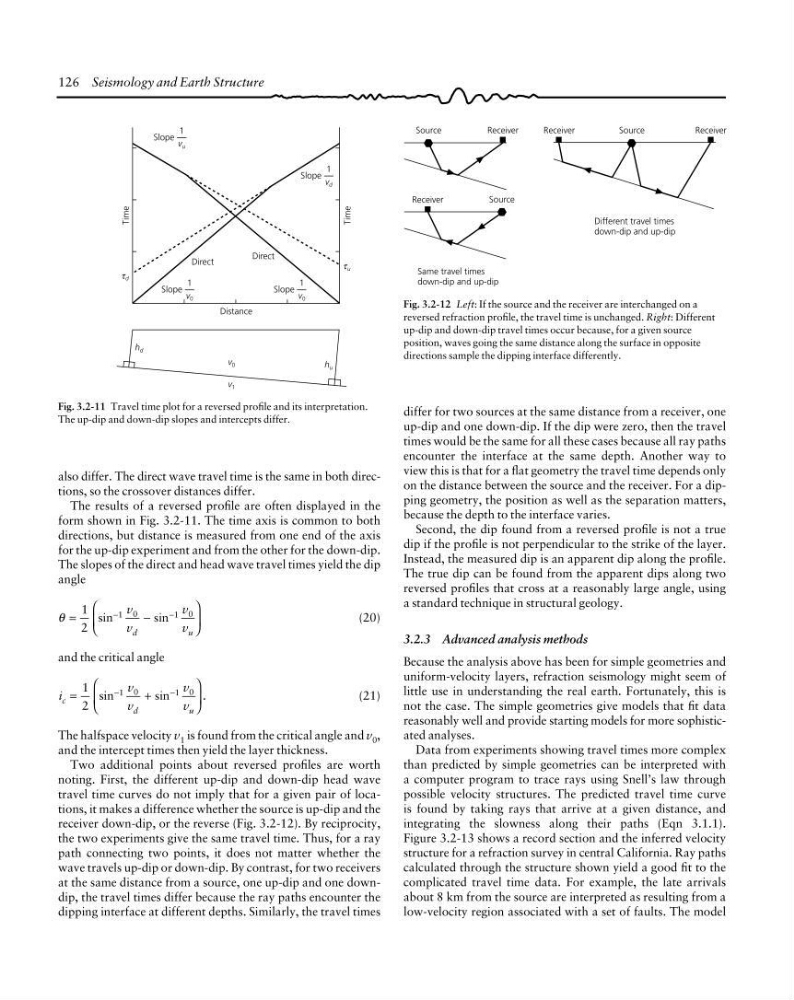
Fig. 3.2-11 Travel time plot for a reversed profile and its interpretation.
The up-dip and down-dip slopes and intercepts differ.
Same travel times
down-dip and up-dip
Source
Receiver
Receiver
Source
Receiver
Source
Receiver
Different travel times
down-dip and up-dip
Fig. 3.2-12 Left: If the source and the receiver are interchanged on a
reversed refraction profile, the travel time is unchanged. Right: Different
up-dip and down-dip travel times occur because, for a given source
position, waves going the same distance along the surface in opposite
directions sample the dipping interface differently.
also differ. The direct wave travel time is the same in both directions, so the crossover distances differ.
The results of a reversed profile are often displayed in the
form shown in Fig. 3.2-11. The time axis is common to both
directions, but distance is measured from one end of the axis
for the up-dip experiment and from the other for the down-dip.
The slopes of the direct and head wave travel times yield the dip
angle
θ
sin
sin
=
−
⎛
⎝
⎜
⎞
⎠
⎟
−
−
1
2
1 0
1 0
v
v
v
v
d
u
(20)
and the critical angle
i
v
v
v
v
c
d
u
=
+
⎛
⎝
⎜
⎞
⎠
⎟
−
−
sin
sin
.
1
2
1 0
1 0
(21)
The halfspace velocity v 1 is found from the critical angle and v 0 ,
and the intercept times then yield the layer thickness.
Two additional points about reversed profiles are worth
noting. First, the different up-dip and down-dip head wave
travel time curves do not imply that for a given pair of locations, it makes a difference whether the source is up-dip and the
receiver down-dip, or the reverse (Fig. 3.2-12). By reciprocity,
the two experiments give the same travel time. Thus, for a ray
path connecting two points, it does not matter whether the
wave travels up-dip or down-dip. By contrast, for two receivers
at the same distance from a source, one up-dip and one downdip, the travel times differ because the ray paths encounter the
dipping interface at different depths. Similarly, the travel times
differ for two sources at the same distance from a receiver, one
up-dip and one down-dip. If the dip were zero, then the travel
times would be the same for all these cases because all ray paths
encounter the interface at the same depth. Another way to
view this is that for a flat geometry the travel time depends only
on the distance between the source and the receiver. For a dipping geometry, the position as well as the separation matters,
because the depth to the interface varies.
Second, the dip found from a reversed profile is not a true
dip if the profile is not perpendicular to the strike of the layer.
Instead, the measured dip is an apparent dip along the profile.
The true dip can be found from the apparent dips along two
reversed profiles that cross at a reasonably large angle, using
a standard technique in structural geology.
3.2.3 Advanced analysis methods
Because the analysis above has been for simple geometries and
uniform-velocity layers, refraction seismology might seem of
little use in understanding the real earth. Fortunately, this is
not the case. The simple geometries give models that fit data
reasonably well and provide starting models for more sophisticated analyses.
Data from experiments showing travel times more complex
than predicted by simple geometries can be interpreted with
a computer program to trace rays using Snell’s law through
possible velocity structures. The predicted travel time curve
is found by taking rays that arrive at a given distance, and
integrating the slowness along their paths (Eqn 3.1.1).
Figure 3.2-13 shows a record section and the inferred velocity
structure for a refraction survey in central California. Ray paths
calculated through the structure shown yield a good fit to the
complicated travel time data. For example, the late arrivals
about 8 km from the source are interpreted as resulting from a
low-velocity region associated with a set of faults. The model
Time
Distance
τ d
h d
h u
v 1
v 0
Direct
Direct
τ u
Slope
1
v 0
Slope
1
v 0
Slope
1
v u
Slope
1
v d
Time
Fig. 3.2-11 Travel time plot for a reversed profile and its interpretation.
The up-dip and down-dip slopes and intercepts differ.
Same travel times
down-dip and up-dip
Source
Receiver
Receiver
Source
Receiver
Source
Receiver
Different travel times
down-dip and up-dip
Fig. 3.2-12 Left: If the source and the receiver are interchanged on a
reversed refraction profile, the travel time is unchanged. Right: Different
up-dip and down-dip travel times occur because, for a given source
position, waves going the same distance along the surface in opposite
directions sample the dipping interface differently.
also differ. The direct wave travel time is the same in both directions, so the crossover distances differ.
The results of a reversed profile are often displayed in the
form shown in Fig. 3.2-11. The time axis is common to both
directions, but distance is measured from one end of the axis
for the up-dip experiment and from the other for the down-dip.
The slopes of the direct and head wave travel times yield the dip
angle
θ
sin
sin
=
−
⎛
⎝
⎜
⎞
⎠
⎟
−
−
1
2
1 0
1 0
v
v
v
v
d
u
(20)
and the critical angle
i
v
v
v
v
c
d
u
=
+
⎛
⎝
⎜
⎞
⎠
⎟
−
−
sin
sin
.
1
2
1 0
1 0
(21)
The halfspace velocity v 1 is found from the critical angle and v 0 ,
and the intercept times then yield the layer thickness.
Two additional points about reversed profiles are worth
noting. First, the different up-dip and down-dip head wave
travel time curves do not imply that for a given pair of locations, it makes a difference whether the source is up-dip and the
receiver down-dip, or the reverse (Fig. 3.2-12). By reciprocity,
the two experiments give the same travel time. Thus, for a ray
path connecting two points, it does not matter whether the
wave travels up-dip or down-dip. By contrast, for two receivers
at the same distance from a source, one up-dip and one downdip, the travel times differ because the ray paths encounter the
dipping interface at different depths. Similarly, the travel times
differ for two sources at the same distance from a receiver, one
up-dip and one down-dip. If the dip were zero, then the travel
times would be the same for all these cases because all ray paths
encounter the interface at the same depth. Another way to
view this is that for a flat geometry the travel time depends only
on the distance between the source and the receiver. For a dipping geometry, the position as well as the separation matters,
because the depth to the interface varies.
Second, the dip found from a reversed profile is not a true
dip if the profile is not perpendicular to the strike of the layer.
Instead, the measured dip is an apparent dip along the profile.
The true dip can be found from the apparent dips along two
reversed profiles that cross at a reasonably large angle, using
a standard technique in structural geology.
3.2.3 Advanced analysis methods
Because the analysis above has been for simple geometries and
uniform-velocity layers, refraction seismology might seem of
little use in understanding the real earth. Fortunately, this is
not the case. The simple geometries give models that fit data
reasonably well and provide starting models for more sophisticated analyses.
Data from experiments showing travel times more complex
than predicted by simple geometries can be interpreted with
a computer program to trace rays using Snell’s law through
possible velocity structures. The predicted travel time curve
is found by taking rays that arrive at a given distance, and
integrating the slowness along their paths (Eqn 3.1.1).
Figure 3.2-13 shows a record section and the inferred velocity
structure for a refraction survey in central California. Ray paths
calculated through the structure shown yield a good fit to the
complicated travel time data. For example, the late arrivals
about 8 km from the source are interpreted as resulting from a
low-velocity region associated with a set of faults. The model
Time
Distance
τ d
h d
h u
v 1
v 0
Direct
Direct
τ u
Slope
1
v 0
Slope
1
v 0
Slope
1
v u
Slope
1
v d
Time