

100 Basic Seismological Theory
Phase velocity (km/s)
4.4
4.2
4.0
3.8
3.6
0
20
40
60
80
100
120
140
Period (s)
0–4 Myr
4–20
20–52
52–110
110+
Depth (km)
0
100
200
300
400
3.5
4.0
4.5
5.0
0–4 Myr
4–20
20–52
52–110
110+
β (km/s)
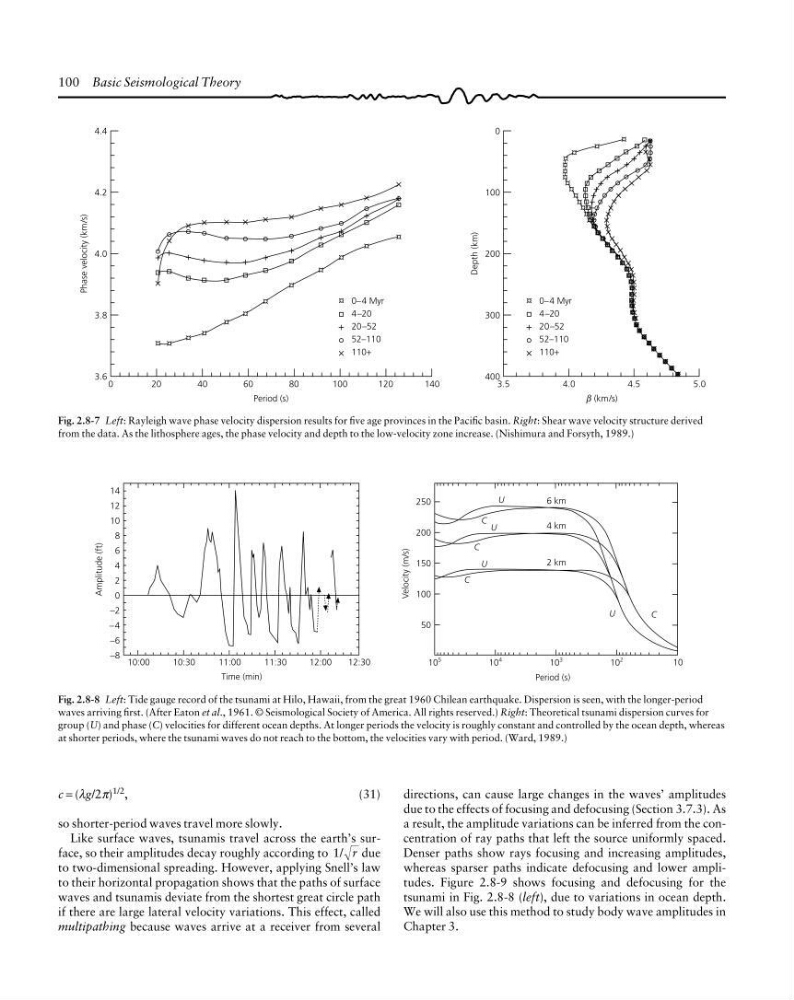
Fig. 2.8-7 Left: Rayleigh wave phase velocity dispersion results for five age provinces in the Pacific basin. Right: Shear wave velocity structure derived
from the data. As the lithosphere ages, the phase velocity and depth to the low-velocity zone increase. (Nishimura and Forsyth, 1989.)
Amplitude (ft)
14
12
10
8
6
4
2
0
−2
−4
−6
−8
10:00
10:30
11:00
11:30
12:00
12:30
Time (min)
Velocity (m/s)
U
U
U
C
C
C
250
200
150
100
50
6 km
4 km
2 km
U
C
10
5
10
4
10
3
10
2
10
Period (s)
Fig. 2.8-8 Left: Tide gauge record of the tsunami at Hilo, Hawaii, from the great 1960 Chilean earthquake. Dispersion is seen, with the longer-period
waves arriving first. (After Eaton et al., 1961. © Seismological Society of America. All rights reserved.) Right: Theoretical tsunami dispersion curves for
group (U) and phase (C) velocities for different ocean depths. At longer periods the velocity is roughly constant and controlled by the ocean depth, whereas
at shorter periods, where the tsunami waves do not reach to the bottom, the velocities vary with period. (Ward, 1989.)
c = (λg/2π) 1/2 ,
(31)
so shorter-period waves travel more slowly.
Like surface waves, tsunamis travel across the earth’s surface, so their amplitudes decay roughly according to 1/ r due
to two-dimensional spreading. However, applying Snell’s law
to their horizontal propagation shows that the paths of surface
waves and tsunamis deviate from the shortest great circle path
if there are large lateral velocity variations. This effect, called
multipathing because waves arrive at a receiver from several
directions, can cause large changes in the waves’ amplitudes
due to the effects of focusing and defocusing (Section 3.7.3). As
a result, the amplitude variations can be inferred from the concentration of ray paths that left the source uniformly spaced.
Denser paths show rays focusing and increasing amplitudes,
whereas sparser paths indicate defocusing and lower amplitudes. Figure 2.8-9 shows focusing and defocusing for the
tsunami in Fig. 2.8-8 (left), due to variations in ocean depth.
We will also use this method to study body wave amplitudes in
Chapter 3.
Phase velocity (km/s)
4.4
4.2
4.0
3.8
3.6
0
20
40
60
80
100
120
140
Period (s)
0–4 Myr
4–20
20–52
52–110
110+
Depth (km)
0
100
200
300
400
3.5
4.0
4.5
5.0
0–4 Myr
4–20
20–52
52–110
110+
β (km/s)
Fig. 2.8-7 Left: Rayleigh wave phase velocity dispersion results for five age provinces in the Pacific basin. Right: Shear wave velocity structure derived
from the data. As the lithosphere ages, the phase velocity and depth to the low-velocity zone increase. (Nishimura and Forsyth, 1989.)
Amplitude (ft)
14
12
10
8
6
4
2
0
−2
−4
−6
−8
10:00
10:30
11:00
11:30
12:00
12:30
Time (min)
Velocity (m/s)
U
U
U
C
C
C
250
200
150
100
50
6 km
4 km
2 km
U
C
10
5
10
4
10
3
10
2
10
Period (s)
Fig. 2.8-8 Left: Tide gauge record of the tsunami at Hilo, Hawaii, from the great 1960 Chilean earthquake. Dispersion is seen, with the longer-period
waves arriving first. (After Eaton et al., 1961. © Seismological Society of America. All rights reserved.) Right: Theoretical tsunami dispersion curves for
group (U) and phase (C) velocities for different ocean depths. At longer periods the velocity is roughly constant and controlled by the ocean depth, whereas
at shorter periods, where the tsunami waves do not reach to the bottom, the velocities vary with period. (Ward, 1989.)
c = (λg/2π) 1/2 ,
(31)
so shorter-period waves travel more slowly.
Like surface waves, tsunamis travel across the earth’s surface, so their amplitudes decay roughly according to 1/ r due
to two-dimensional spreading. However, applying Snell’s law
to their horizontal propagation shows that the paths of surface
waves and tsunamis deviate from the shortest great circle path
if there are large lateral velocity variations. This effect, called
multipathing because waves arrive at a receiver from several
directions, can cause large changes in the waves’ amplitudes
due to the effects of focusing and defocusing (Section 3.7.3). As
a result, the amplitude variations can be inferred from the concentration of ray paths that left the source uniformly spaced.
Denser paths show rays focusing and increasing amplitudes,
whereas sparser paths indicate defocusing and lower amplitudes. Figure 2.8-9 shows focusing and defocusing for the
tsunami in Fig. 2.8-8 (left), due to variations in ocean depth.
We will also use this method to study body wave amplitudes in
Chapter 3.