

48
P. Lazo et al.
3.4.12 Rubidium, Rb and Cesium, Cs
Trace elements showed higher variations than major elements from study to study,
but the lithophile crustal trace elements, such as REEs, Li, Sr, Rb, Cs, Zr, Hf, Th and
U, are relatively constant and do not vary beyond 50% between studies (Rudnick
and Gao 2003). The same behaviour was found in current moss samples for most of
the litophile elements, including also Rb and Cs. Both elements showed moderate
variation (CV % = 33% and 58% for Rb and Cs respectively). Rb ranged from 2.7
to 14 mg kg
−1 , with a mean concentration of 7.8 mg kg
−1 , and Cs ranged from 0.086
to 0.77 mg kg
−1 , with a mean concentration of 0.31 mg kg
−1 . The spatial analysis of
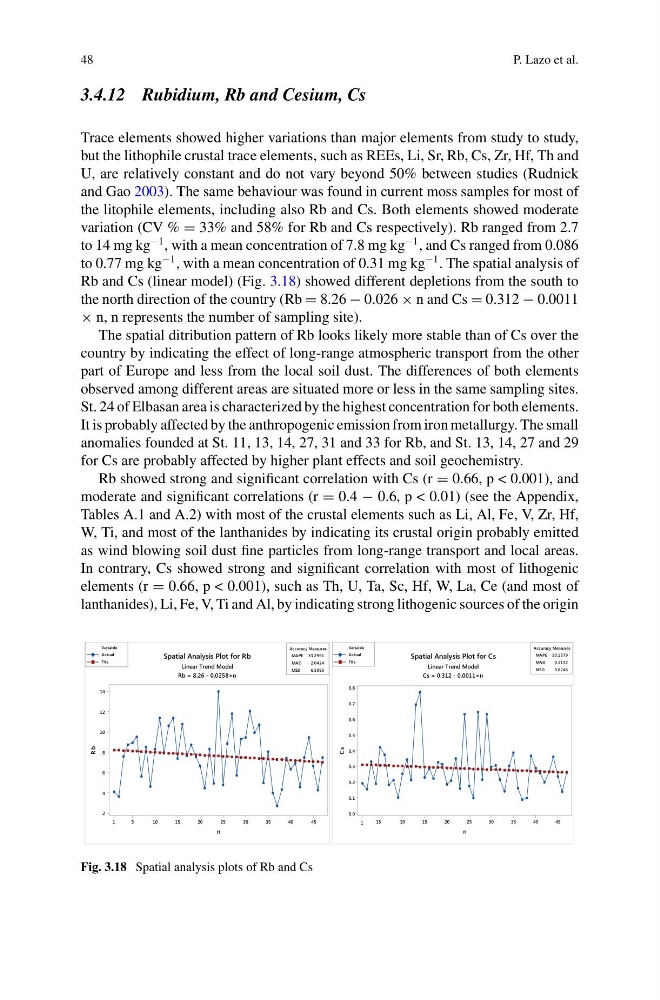
Rb and Cs (linear model) (Fig. 3.18) showed different depletions from the south to
the north direction of the country (Rb = 8.26 − 0.026 × n and Cs = 0.312 − 0.0011
× n, n represents the number of sampling site).
The spatial ditribution pattern of Rb looks likely more stable than of Cs over the
country by indicating the effect of long-range atmospheric transport from the other
part of Europe and less from the local soil dust. The differences of both elements
observed among different areas are situated more or less in the same sampling sites.
St. 24 of Elbasan area is characterized by the highest concentration for both elements.
It is probably affected by the anthropogenic emission from iron metallurgy. The small
anomalies founded at St. 11, 13, 14, 27, 31 and 33 for Rb, and St. 13, 14, 27 and 29
for Cs are probably affected by higher plant effects and soil geochemistry.
Rb showed strong and significant correlation with Cs (r = 0.66, p < 0.001), and
moderate and significant correlations (r = 0.4 − 0.6, p < 0.01) (see the Appendix,
Tables A.1 and A.2) with most of the crustal elements such as Li, Al, Fe, V, Zr, Hf,
W, Ti, and most of the lanthanides by indicating its crustal origin probably emitted
as wind blowing soil dust fine particles from long-range transport and local areas.
In contrary, Cs showed strong and significant correlation with most of lithogenic
elements (r = 0.66, p < 0.001), such as Th, U, Ta, Sc, Hf, W, La, Ce (and most of
lanthanides), Li, Fe, V, Ti and Al, by indicating strong lithogenic sources of the origin
45
40
35
30
25
20
15
10
5
1
14
12
10
8
6
4
2
MAPE 33.2991
MAD
2.0424
MSD
6.5093
Accuracy Measures
n
R b
Actual
Fits
Variable
Spatial Analysis Plot for Rb
Linear Trend Model
Rb = 8.26 - 0.0258×n
45
40
35
30
25
20
15
10
15
0.8
0.7
0.6
0.5
0.4
0.3
0.2
0.1
0.0
MAPE 50.1379
MAD
0.1142
MSD
0.0246
Accuracy Measures
n
C s
Actual
Fits
Variable
Spatial Analysis Plot for Cs
Linear Trend Model
Cs = 0.312 - 0.0011×n
1
Fig. 3.18 Spatial analysis plots of Rb and Cs
P. Lazo et al.
3.4.12 Rubidium, Rb and Cesium, Cs
Trace elements showed higher variations than major elements from study to study,
but the lithophile crustal trace elements, such as REEs, Li, Sr, Rb, Cs, Zr, Hf, Th and
U, are relatively constant and do not vary beyond 50% between studies (Rudnick
and Gao 2003). The same behaviour was found in current moss samples for most of
the litophile elements, including also Rb and Cs. Both elements showed moderate
variation (CV % = 33% and 58% for Rb and Cs respectively). Rb ranged from 2.7
to 14 mg kg
−1 , with a mean concentration of 7.8 mg kg
−1 , and Cs ranged from 0.086
to 0.77 mg kg
−1 , with a mean concentration of 0.31 mg kg
−1 . The spatial analysis of
Rb and Cs (linear model) (Fig. 3.18) showed different depletions from the south to
the north direction of the country (Rb = 8.26 − 0.026 × n and Cs = 0.312 − 0.0011
× n, n represents the number of sampling site).
The spatial ditribution pattern of Rb looks likely more stable than of Cs over the
country by indicating the effect of long-range atmospheric transport from the other
part of Europe and less from the local soil dust. The differences of both elements
observed among different areas are situated more or less in the same sampling sites.
St. 24 of Elbasan area is characterized by the highest concentration for both elements.
It is probably affected by the anthropogenic emission from iron metallurgy. The small
anomalies founded at St. 11, 13, 14, 27, 31 and 33 for Rb, and St. 13, 14, 27 and 29
for Cs are probably affected by higher plant effects and soil geochemistry.
Rb showed strong and significant correlation with Cs (r = 0.66, p < 0.001), and
moderate and significant correlations (r = 0.4 − 0.6, p < 0.01) (see the Appendix,
Tables A.1 and A.2) with most of the crustal elements such as Li, Al, Fe, V, Zr, Hf,
W, Ti, and most of the lanthanides by indicating its crustal origin probably emitted
as wind blowing soil dust fine particles from long-range transport and local areas.
In contrary, Cs showed strong and significant correlation with most of lithogenic
elements (r = 0.66, p < 0.001), such as Th, U, Ta, Sc, Hf, W, La, Ce (and most of
lanthanides), Li, Fe, V, Ti and Al, by indicating strong lithogenic sources of the origin
45
40
35
30
25
20
15
10
5
1
14
12
10
8
6
4
2
MAPE 33.2991
MAD
2.0424
MSD
6.5093
Accuracy Measures
n
R b
Actual
Fits
Variable
Spatial Analysis Plot for Rb
Linear Trend Model
Rb = 8.26 - 0.0258×n
45
40
35
30
25
20
15
10
15
0.8
0.7
0.6
0.5
0.4
0.3
0.2
0.1
0.0
MAPE 50.1379
MAD
0.1142
MSD
0.0246
Accuracy Measures
n
C s
Actual
Fits
Variable
Spatial Analysis Plot for Cs
Linear Trend Model
Cs = 0.312 - 0.0011×n
1
Fig. 3.18 Spatial analysis plots of Rb and Cs