

3 The Evaluation of TM Atmospheric Deposition in Albania
47
mining and mineral processing, emissions from steel and iron production, and the
combustion of fossil fuels (Howe et al. 2004). Besides, the Mn, Rb and Cs considered
as elements with no connection to air pollution (Steinnes et al. 2016).
Mn content in moss samples ranged from 22 to 284 which are within the normal
background range of Mn in soil. It showed higher variations (CV % = 78%) than other
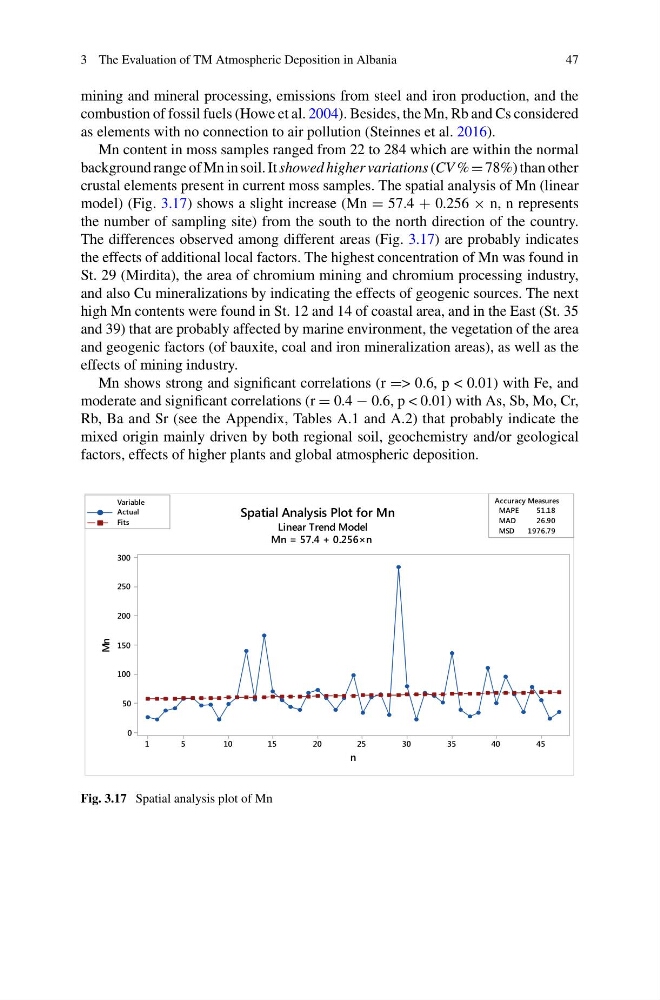
crustal elements present in current moss samples. The spatial analysis of Mn (linear
model) (Fig. 3.17) shows a slight increase (Mn = 57.4 + 0.256 × n, n represents
the number of sampling site) from the south to the north direction of the country.
The differences observed among different areas (Fig. 3.17) are probably indicates
the effects of additional local factors. The highest concentration of Mn was found in
St. 29 (Mirdita), the area of chromium mining and chromium processing industry,
and also Cu mineralizations by indicating the effects of geogenic sources. The next
high Mn contents were found in St. 12 and 14 of coastal area, and in the East (St. 35
and 39) that are probably affected by marine environment, the vegetation of the area
and geogenic factors (of bauxite, coal and iron mineralization areas), as well as the
effects of mining industry.
Mn shows strong and significant correlations (r => 0.6, p < 0.01) with Fe, and
moderate and significant correlations (r = 0.4 − 0.6, p < 0.01) with As, Sb, Mo, Cr,
Rb, Ba and Sr (see the Appendix, Tables A.1 and A.2) that probably indicate the
mixed origin mainly driven by both regional soil, geochemistry and/or geological
factors, effects of higher plants and global atmospheric deposition.
45
40
35
30
25
20
15
10
5
1
300
250
200
150
100
50
0
MAPE
51.18
MAD
26.90
MSD
1976.79
Accuracy Measures
n
Mn
Actual
Fits
Variable
Spatial Analysis Plot for Mn
Linear Trend Model
Mn = 57.4 + 0.256×n
Fig. 3.17 Spatial analysis plot of Mn
47
mining and mineral processing, emissions from steel and iron production, and the
combustion of fossil fuels (Howe et al. 2004). Besides, the Mn, Rb and Cs considered
as elements with no connection to air pollution (Steinnes et al. 2016).
Mn content in moss samples ranged from 22 to 284 which are within the normal
background range of Mn in soil. It showed higher variations (CV % = 78%) than other
crustal elements present in current moss samples. The spatial analysis of Mn (linear
model) (Fig. 3.17) shows a slight increase (Mn = 57.4 + 0.256 × n, n represents
the number of sampling site) from the south to the north direction of the country.
The differences observed among different areas (Fig. 3.17) are probably indicates
the effects of additional local factors. The highest concentration of Mn was found in
St. 29 (Mirdita), the area of chromium mining and chromium processing industry,
and also Cu mineralizations by indicating the effects of geogenic sources. The next
high Mn contents were found in St. 12 and 14 of coastal area, and in the East (St. 35
and 39) that are probably affected by marine environment, the vegetation of the area
and geogenic factors (of bauxite, coal and iron mineralization areas), as well as the
effects of mining industry.
Mn shows strong and significant correlations (r => 0.6, p < 0.01) with Fe, and
moderate and significant correlations (r = 0.4 − 0.6, p < 0.01) with As, Sb, Mo, Cr,
Rb, Ba and Sr (see the Appendix, Tables A.1 and A.2) that probably indicate the
mixed origin mainly driven by both regional soil, geochemistry and/or geological
factors, effects of higher plants and global atmospheric deposition.
45
40
35
30
25
20
15
10
5
1
300
250
200
150
100
50
0
MAPE
51.18
MAD
26.90
MSD
1976.79
Accuracy Measures
n
Mn
Actual
Fits
Variable
Spatial Analysis Plot for Mn
Linear Trend Model
Mn = 57.4 + 0.256×n
Fig. 3.17 Spatial analysis plot of Mn