

Employing Input-Output Model to Assess …
173
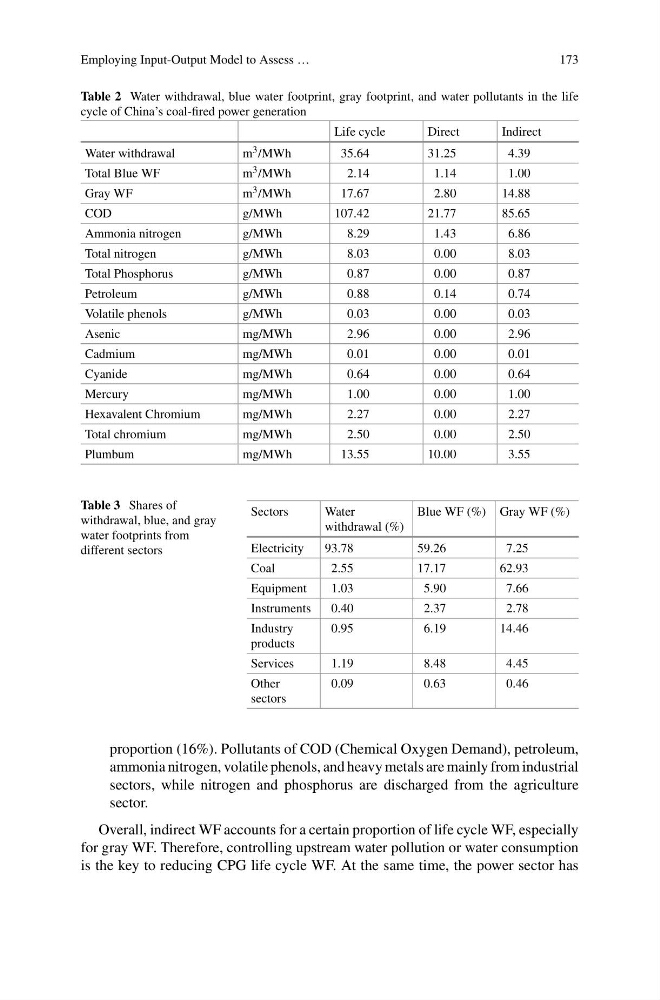
Table 2 Water withdrawal, blue water footprint, gray footprint, and water pollutants in the life
cycle of China’s coal-fired power generation
Life cycle
Direct
Indirect
Water withdrawal
m 3 /MWh
35.64
31.25
4.39
Total Blue WF
m 3 /MWh
2.14
1.14
1.00
Gray WF
m 3 /MWh
17.67
2.80
14.88
COD
g/MWh
107.42
21.77
85.65
Ammonia nitrogen
g/MWh
8.29
1.43
6.86
Total nitrogen
g/MWh
8.03
0.00
8.03
Total Phosphorus
g/MWh
0.87
0.00
0.87
Petroleum
g/MWh
0.88
0.14
0.74
Volatile phenols
g/MWh
0.03
0.00
0.03
Asenic
mg/MWh
2.96
0.00
2.96
Cadmium
mg/MWh
0.01
0.00
0.01
Cyanide
mg/MWh
0.64
0.00
0.64
Mercury
mg/MWh
1.00
0.00
1.00
Hexavalent Chromium
mg/MWh
2.27
0.00
2.27
Total chromium
mg/MWh
2.50
0.00
2.50
Plumbum
mg/MWh
13.55
10.00
3.55
Table 3 Shares of
withdrawal, blue, and gray
water footprints from
different sectors
Sectors
Water
withdrawal (%)
Blue WF (%) Gray WF (%)
Electricity
93.78
59.26
7.25
Coal
2.55
17.17
62.93
Equipment
1.03
5.90
7.66
Instruments
0.40
2.37
2.78
Industry
products
0.95
6.19
14.46
Services
1.19
8.48
4.45
Other
sectors
0.09
0.63
0.46
proportion (16%). Pollutants of COD (Chemical Oxygen Demand), petroleum,
ammonia nitrogen, volatile phenols, and heavy metals are mainly from industrial
sectors, while nitrogen and phosphorus are discharged from the agriculture
sector.
Overall, indirect WF accounts for a certain proportion of life cycle WF, especially
for gray WF. Therefore, controlling upstream water pollution or water consumption
is the key to reducing CPG life cycle WF. At the same time, the power sector has
173
Table 2 Water withdrawal, blue water footprint, gray footprint, and water pollutants in the life
cycle of China’s coal-fired power generation
Life cycle
Direct
Indirect
Water withdrawal
m 3 /MWh
35.64
31.25
4.39
Total Blue WF
m 3 /MWh
2.14
1.14
1.00
Gray WF
m 3 /MWh
17.67
2.80
14.88
COD
g/MWh
107.42
21.77
85.65
Ammonia nitrogen
g/MWh
8.29
1.43
6.86
Total nitrogen
g/MWh
8.03
0.00
8.03
Total Phosphorus
g/MWh
0.87
0.00
0.87
Petroleum
g/MWh
0.88
0.14
0.74
Volatile phenols
g/MWh
0.03
0.00
0.03
Asenic
mg/MWh
2.96
0.00
2.96
Cadmium
mg/MWh
0.01
0.00
0.01
Cyanide
mg/MWh
0.64
0.00
0.64
Mercury
mg/MWh
1.00
0.00
1.00
Hexavalent Chromium
mg/MWh
2.27
0.00
2.27
Total chromium
mg/MWh
2.50
0.00
2.50
Plumbum
mg/MWh
13.55
10.00
3.55
Table 3 Shares of
withdrawal, blue, and gray
water footprints from
different sectors
Sectors
Water
withdrawal (%)
Blue WF (%) Gray WF (%)
Electricity
93.78
59.26
7.25
Coal
2.55
17.17
62.93
Equipment
1.03
5.90
7.66
Instruments
0.40
2.37
2.78
Industry
products
0.95
6.19
14.46
Services
1.19
8.48
4.45
Other
sectors
0.09
0.63
0.46
proportion (16%). Pollutants of COD (Chemical Oxygen Demand), petroleum,
ammonia nitrogen, volatile phenols, and heavy metals are mainly from industrial
sectors, while nitrogen and phosphorus are discharged from the agriculture
sector.
Overall, indirect WF accounts for a certain proportion of life cycle WF, especially
for gray WF. Therefore, controlling upstream water pollution or water consumption
is the key to reducing CPG life cycle WF. At the same time, the power sector has