

174
L. Chai et al.
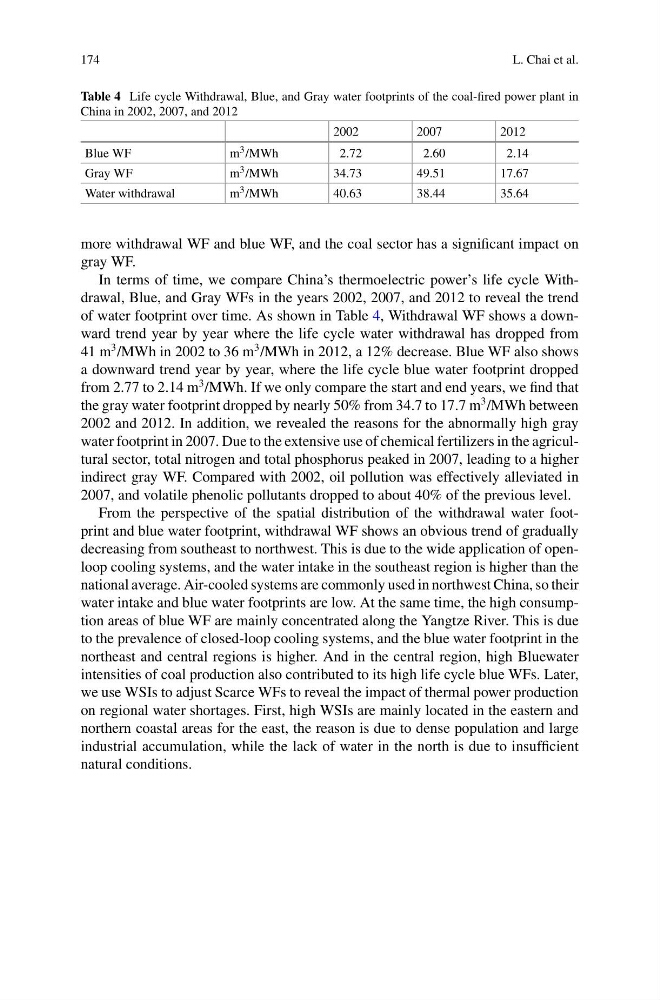
Table 4 Life cycle Withdrawal, Blue, and Gray water footprints of the coal-fired power plant in
China in 2002, 2007, and 2012
2002
2007
2012
Blue WF
m 3 /MWh
2.72
2.60
2.14
Gray WF
m 3 /MWh
34.73
49.51
17.67
Water withdrawal
m 3 /MWh
40.63
38.44
35.64
more withdrawal WF and blue WF, and the coal sector has a significant impact on
gray WF.
In terms of time, we compare China’s thermoelectric power’s life cycle Withdrawal, Blue, and Gray WFs in the years 2002, 2007, and 2012 to reveal the trend
of water footprint over time. As shown in Table 4, Withdrawal WF shows a downward trend year by year where the life cycle water withdrawal has dropped from
41 m
3 /MWh in 2002 to 36 m
3 /MWh in 2012, a 12% decrease. Blue WF also shows
a downward trend year by year, where the life cycle blue water footprint dropped
from 2.77 to 2.14 m
3 /MWh. If we only compare the start and end years, we find that
the gray water footprint dropped by nearly 50% from 34.7 to 17.7 m
3 /MWh between
2002 and 2012. In addition, we revealed the reasons for the abnormally high gray
water footprint in 2007. Due to the extensive use of chemical fertilizers in the agricultural sector, total nitrogen and total phosphorus peaked in 2007, leading to a higher
indirect gray WF. Compared with 2002, oil pollution was effectively alleviated in
2007, and volatile phenolic pollutants dropped to about 40% of the previous level.
From the perspective of the spatial distribution of the withdrawal water footprint and blue water footprint, withdrawal WF shows an obvious trend of gradually
decreasing from southeast to northwest. This is due to the wide application of openloop cooling systems, and the water intake in the southeast region is higher than the
national average. Air-cooled systems are commonly used in northwest China, so their
water intake and blue water footprints are low. At the same time, the high consumption areas of blue WF are mainly concentrated along the Yangtze River. This is due
to the prevalence of closed-loop cooling systems, and the blue water footprint in the
northeast and central regions is higher. And in the central region, high Bluewater
intensities of coal production also contributed to its high life cycle blue WFs. Later,
we use WSIs to adjust Scarce WFs to reveal the impact of thermal power production
on regional water shortages. First, high WSIs are mainly located in the eastern and
northern coastal areas for the east, the reason is due to dense population and large
industrial accumulation, while the lack of water in the north is due to insufficient
natural conditions.
L. Chai et al.
Table 4 Life cycle Withdrawal, Blue, and Gray water footprints of the coal-fired power plant in
China in 2002, 2007, and 2012
2002
2007
2012
Blue WF
m 3 /MWh
2.72
2.60
2.14
Gray WF
m 3 /MWh
34.73
49.51
17.67
Water withdrawal
m 3 /MWh
40.63
38.44
35.64
more withdrawal WF and blue WF, and the coal sector has a significant impact on
gray WF.
In terms of time, we compare China’s thermoelectric power’s life cycle Withdrawal, Blue, and Gray WFs in the years 2002, 2007, and 2012 to reveal the trend
of water footprint over time. As shown in Table 4, Withdrawal WF shows a downward trend year by year where the life cycle water withdrawal has dropped from
41 m
3 /MWh in 2002 to 36 m
3 /MWh in 2012, a 12% decrease. Blue WF also shows
a downward trend year by year, where the life cycle blue water footprint dropped
from 2.77 to 2.14 m
3 /MWh. If we only compare the start and end years, we find that
the gray water footprint dropped by nearly 50% from 34.7 to 17.7 m
3 /MWh between
2002 and 2012. In addition, we revealed the reasons for the abnormally high gray
water footprint in 2007. Due to the extensive use of chemical fertilizers in the agricultural sector, total nitrogen and total phosphorus peaked in 2007, leading to a higher
indirect gray WF. Compared with 2002, oil pollution was effectively alleviated in
2007, and volatile phenolic pollutants dropped to about 40% of the previous level.
From the perspective of the spatial distribution of the withdrawal water footprint and blue water footprint, withdrawal WF shows an obvious trend of gradually
decreasing from southeast to northwest. This is due to the wide application of openloop cooling systems, and the water intake in the southeast region is higher than the
national average. Air-cooled systems are commonly used in northwest China, so their
water intake and blue water footprints are low. At the same time, the high consumption areas of blue WF are mainly concentrated along the Yangtze River. This is due
to the prevalence of closed-loop cooling systems, and the blue water footprint in the
northeast and central regions is higher. And in the central region, high Bluewater
intensities of coal production also contributed to its high life cycle blue WFs. Later,
we use WSIs to adjust Scarce WFs to reveal the impact of thermal power production
on regional water shortages. First, high WSIs are mainly located in the eastern and
northern coastal areas for the east, the reason is due to dense population and large
industrial accumulation, while the lack of water in the north is due to insufficient
natural conditions.