

172
L. Chai et al.
262
468
360
635
813
313
863
663
1531
1703
1374
4780
1018
3709
6152
121
557
416
15084
6016
5241
9358
7206
12706
16269
313
863
663
1531
1703
69
239
51
185
308
3
2
75
30
Coal
Crude Oil
Natural Gas
Coke
Petroleum Products
10
0
10
1
10
2
10
3
10
4
10
5
Dilution water (m
3
/ TJ)
COD (20 mg/L)
AN (1 mg/L)
PE (0.05 mg/L)
VP (0.005 mg/L)
Coal
Crude Oil
Natural Gas
Coke
Petroleum Products
10
0
10
2
10
4
Water pollutant discharge (g/ TJ)
a
b
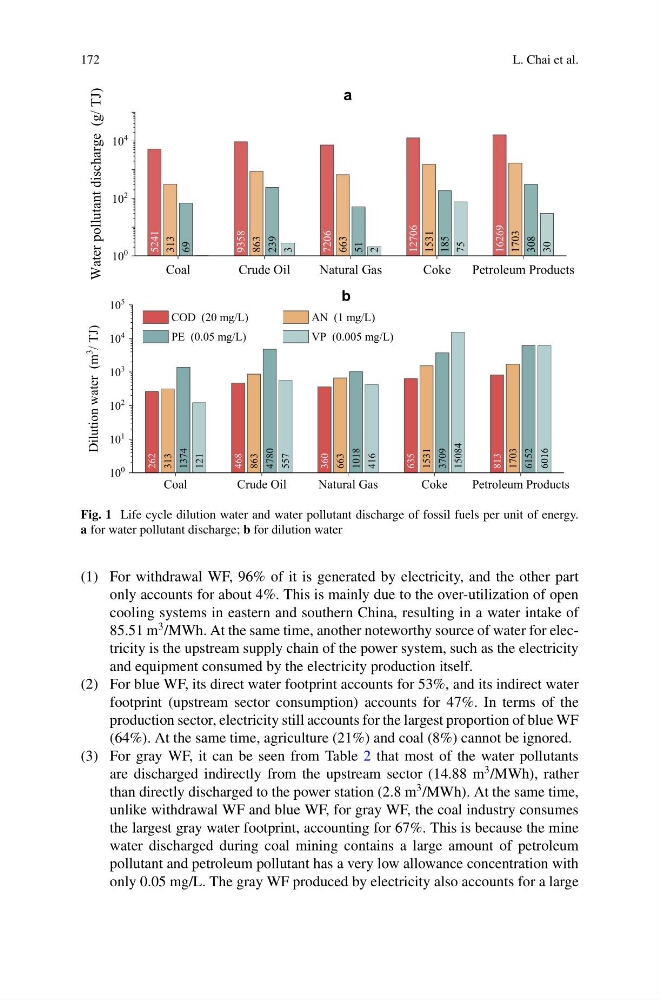
Fig. 1 Life cycle dilution water and water pollutant discharge of fossil fuels per unit of energy.
a for water pollutant discharge; b for dilution water
(1) For withdrawal WF, 96% of it is generated by electricity, and the other part
only accounts for about 4%. This is mainly due to the over-utilization of open
cooling systems in eastern and southern China, resulting in a water intake of
85.51 m
3 /MWh. At the same time, another noteworthy source of water for electricity is the upstream supply chain of the power system, such as the electricity
and equipment consumed by the electricity production itself.
(2) For blue WF, its direct water footprint accounts for 53%, and its indirect water
footprint (upstream sector consumption) accounts for 47%. In terms of the
production sector, electricity still accounts for the largest proportion of blue WF
(64%). At the same time, agriculture (21%) and coal (8%) cannot be ignored.
(3) For gray WF, it can be seen from Table 2 that most of the water pollutants
are discharged indirectly from the upstream sector (14.88 m
3 /MWh), rather
than directly discharged to the power station (2.8 m
3 /MWh). At the same time,
unlike withdrawal WF and blue WF, for gray WF, the coal industry consumes
the largest gray water footprint, accounting for 67%. This is because the mine
water discharged during coal mining contains a large amount of petroleum
pollutant and petroleum pollutant has a very low allowance concentration with
only 0.05 mg/L. The gray WF produced by electricity also accounts for a large
L. Chai et al.
262
468
360
635
813
313
863
663
1531
1703
1374
4780
1018
3709
6152
121
557
416
15084
6016
5241
9358
7206
12706
16269
313
863
663
1531
1703
69
239
51
185
308
3
2
75
30
Coal
Crude Oil
Natural Gas
Coke
Petroleum Products
10
0
10
1
10
2
10
3
10
4
10
5
Dilution water (m
3
/ TJ)
COD (20 mg/L)
AN (1 mg/L)
PE (0.05 mg/L)
VP (0.005 mg/L)
Coal
Crude Oil
Natural Gas
Coke
Petroleum Products
10
0
10
2
10
4
Water pollutant discharge (g/ TJ)
a
b
Fig. 1 Life cycle dilution water and water pollutant discharge of fossil fuels per unit of energy.
a for water pollutant discharge; b for dilution water
(1) For withdrawal WF, 96% of it is generated by electricity, and the other part
only accounts for about 4%. This is mainly due to the over-utilization of open
cooling systems in eastern and southern China, resulting in a water intake of
85.51 m
3 /MWh. At the same time, another noteworthy source of water for electricity is the upstream supply chain of the power system, such as the electricity
and equipment consumed by the electricity production itself.
(2) For blue WF, its direct water footprint accounts for 53%, and its indirect water
footprint (upstream sector consumption) accounts for 47%. In terms of the
production sector, electricity still accounts for the largest proportion of blue WF
(64%). At the same time, agriculture (21%) and coal (8%) cannot be ignored.
(3) For gray WF, it can be seen from Table 2 that most of the water pollutants
are discharged indirectly from the upstream sector (14.88 m
3 /MWh), rather
than directly discharged to the power station (2.8 m
3 /MWh). At the same time,
unlike withdrawal WF and blue WF, for gray WF, the coal industry consumes
the largest gray water footprint, accounting for 67%. This is because the mine
water discharged during coal mining contains a large amount of petroleum
pollutant and petroleum pollutant has a very low allowance concentration with
only 0.05 mg/L. The gray WF produced by electricity also accounts for a large