

Employing Input-Output Model to Assess …
171
W SI =
1
1 + e −6.4W T A∗(1/0.01−1)
where WTA* is a modified water withdrawal-to-availability dimensionless indicator
that considers precipitation variability.
This research introduces the MUIO model as an extension of the standard currency
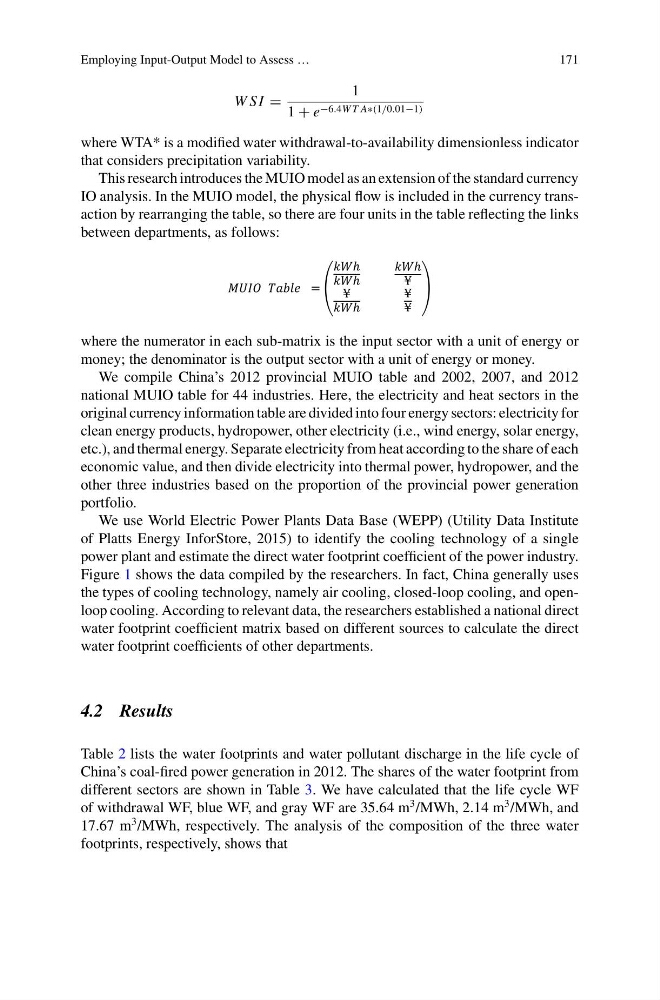
IO analysis. In the MUIO model, the physical flow is included in the currency transaction by rearranging the table, so there are four units in the table reflecting the links
between departments, as follows:
where the numerator in each sub-matrix is the input sector with a unit of energy or
money; the denominator is the output sector with a unit of energy or money.
We compile China’s 2012 provincial MUIO table and 2002, 2007, and 2012
national MUIO table for 44 industries. Here, the electricity and heat sectors in the
original currency information table are divided into four energy sectors: electricity for
clean energy products, hydropower, other electricity (i.e., wind energy, solar energy,
etc.), and thermal energy. Separate electricity from heat according to the share of each
economic value, and then divide electricity into thermal power, hydropower, and the
other three industries based on the proportion of the provincial power generation
portfolio.
We use World Electric Power Plants Data Base (WEPP) (Utility Data Institute
of Platts Energy InforStore, 2015) to identify the cooling technology of a single
power plant and estimate the direct water footprint coefficient of the power industry.
Figure 1 shows the data compiled by the researchers. In fact, China generally uses
the types of cooling technology, namely air cooling, closed-loop cooling, and openloop cooling. According to relevant data, the researchers established a national direct
water footprint coefficient matrix based on different sources to calculate the direct
water footprint coefficients of other departments.
4.2 Results
Table 2 lists the water footprints and water pollutant discharge in the life cycle of
China’s coal-fired power generation in 2012. The shares of the water footprint from
different sectors are shown in Table 3. We have calculated that the life cycle WF
of withdrawal WF, blue WF, and gray WF are 35.64 m
3 /MWh, 2.14 m
3 /MWh, and
17.67 m
3 /MWh, respectively. The analysis of the composition of the three water
footprints, respectively, shows that
171
W SI =
1
1 + e −6.4W T A∗(1/0.01−1)
where WTA* is a modified water withdrawal-to-availability dimensionless indicator
that considers precipitation variability.
This research introduces the MUIO model as an extension of the standard currency
IO analysis. In the MUIO model, the physical flow is included in the currency transaction by rearranging the table, so there are four units in the table reflecting the links
between departments, as follows:
where the numerator in each sub-matrix is the input sector with a unit of energy or
money; the denominator is the output sector with a unit of energy or money.
We compile China’s 2012 provincial MUIO table and 2002, 2007, and 2012
national MUIO table for 44 industries. Here, the electricity and heat sectors in the
original currency information table are divided into four energy sectors: electricity for
clean energy products, hydropower, other electricity (i.e., wind energy, solar energy,
etc.), and thermal energy. Separate electricity from heat according to the share of each
economic value, and then divide electricity into thermal power, hydropower, and the
other three industries based on the proportion of the provincial power generation
portfolio.
We use World Electric Power Plants Data Base (WEPP) (Utility Data Institute
of Platts Energy InforStore, 2015) to identify the cooling technology of a single
power plant and estimate the direct water footprint coefficient of the power industry.
Figure 1 shows the data compiled by the researchers. In fact, China generally uses
the types of cooling technology, namely air cooling, closed-loop cooling, and openloop cooling. According to relevant data, the researchers established a national direct
water footprint coefficient matrix based on different sources to calculate the direct
water footprint coefficients of other departments.
4.2 Results
Table 2 lists the water footprints and water pollutant discharge in the life cycle of
China’s coal-fired power generation in 2012. The shares of the water footprint from
different sectors are shown in Table 3. We have calculated that the life cycle WF
of withdrawal WF, blue WF, and gray WF are 35.64 m
3 /MWh, 2.14 m
3 /MWh, and
17.67 m
3 /MWh, respectively. The analysis of the composition of the three water
footprints, respectively, shows that