

enhances data accuracy by adjusting the statistic based on the number of independent
variables in the model (Kothari and Gaurav 2019). The F- ratios reveals that the
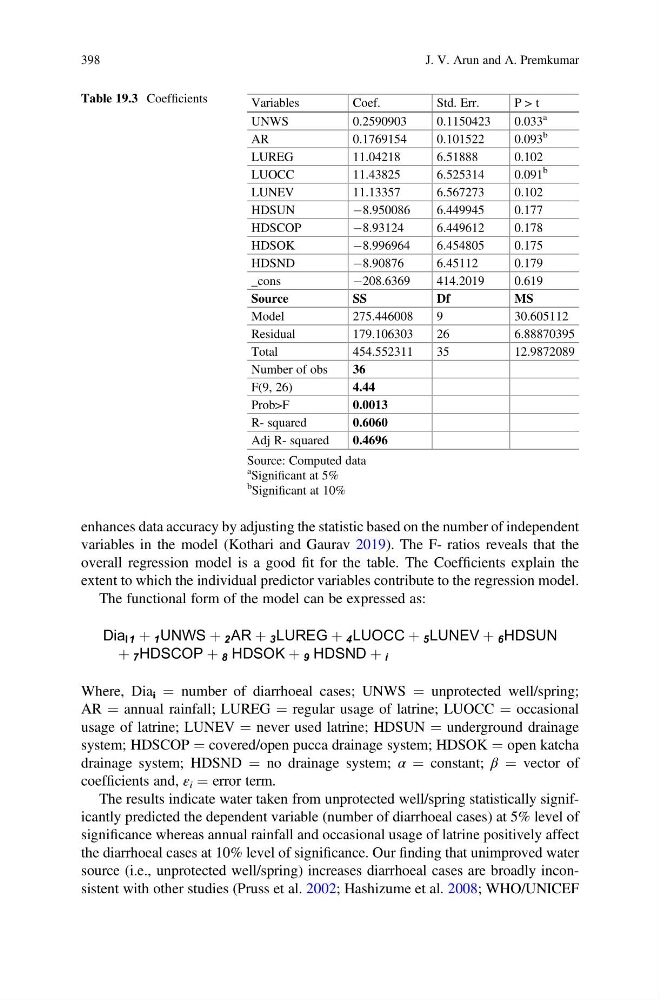
overall regression model is a good fit for the table. The Coefficients explain the
extent to which the individual predictor variables contribute to the regression model.
The functional form of the model can be expressed as:
Dia I1 þ 1 UNWS þ 2 AR þ 3 LUREG þ 4 LUOCC þ 5 LUNEV þ 6 HDSUN
þ 7 HDSCOP þ 8 HDSOK þ 9 HDSND þ i
Where, Dia i ¼ number of diarrhoeal cases; UNWS ¼ unprotected well/spring;
AR ¼ annual rainfall; LUREG ¼ regular usage of latrine; LUOCC ¼ occasional
usage of latrine; LUNEV ¼ never used latrine; HDSUN ¼ underground drainage
system; HDSCOP ¼ covered/open pucca drainage system; HDSOK ¼ open katcha
drainage system; HDSND ¼ no drainage system; α ¼ constant; β ¼ vector of
coefficients and, ε i ¼ error term.
The results indicate water taken from unprotected well/spring statistically significantly predicted the dependent variable (number of diarrhoeal cases) at 5% level of
significance whereas annual rainfall and occasional usage of latrine positively affect
the diarrhoeal cases at 10% level of significance. Our finding that unimproved water
source (i.e., unprotected well/spring) increases diarrhoeal cases are broadly inconsistent with other studies (Pruss et al. 2002; Hashizume et al. 2008; WHO/UNICEF
Table 19.3 Coefficients
Variables
Coef.
Std. Err.
P > t
UNWS
0.2590903
0.1150423
0.033
a
AR
0.1769154
0.101522
0.093
b
LUREG
11.04218
6.51888
0.102
LUOCC
11.43825
6.525314
0.091
b
LUNEV
11.13357
6.567273
0.102
HDSUN
À8.950086
6.449945
0.177
HDSCOP
À8.93124
6.449612
0.178
HDSOK
À8.996964
6.454805
0.175
HDSND
À8.90876
6.45112
0.179
_cons
À208.6369
414.2019
0.619
Source
SS
Df
MS
Model
275.446008
9
30.605112
Residual
179.106303
26
6.88870395
Total
454.552311
35
12.9872089
Number of obs
36
F(9, 26)
4.44
Prob>F
0.0013
R- squared
0.6060
Adj R- squared
0.4696
Source: Computed data
a Significant at 5%
b
Significant at 10%
398
J. V. Arun and A. Premkumar
variables in the model (Kothari and Gaurav 2019). The F- ratios reveals that the
overall regression model is a good fit for the table. The Coefficients explain the
extent to which the individual predictor variables contribute to the regression model.
The functional form of the model can be expressed as:
Dia I1 þ 1 UNWS þ 2 AR þ 3 LUREG þ 4 LUOCC þ 5 LUNEV þ 6 HDSUN
þ 7 HDSCOP þ 8 HDSOK þ 9 HDSND þ i
Where, Dia i ¼ number of diarrhoeal cases; UNWS ¼ unprotected well/spring;
AR ¼ annual rainfall; LUREG ¼ regular usage of latrine; LUOCC ¼ occasional
usage of latrine; LUNEV ¼ never used latrine; HDSUN ¼ underground drainage
system; HDSCOP ¼ covered/open pucca drainage system; HDSOK ¼ open katcha
drainage system; HDSND ¼ no drainage system; α ¼ constant; β ¼ vector of
coefficients and, ε i ¼ error term.
The results indicate water taken from unprotected well/spring statistically significantly predicted the dependent variable (number of diarrhoeal cases) at 5% level of
significance whereas annual rainfall and occasional usage of latrine positively affect
the diarrhoeal cases at 10% level of significance. Our finding that unimproved water
source (i.e., unprotected well/spring) increases diarrhoeal cases are broadly inconsistent with other studies (Pruss et al. 2002; Hashizume et al. 2008; WHO/UNICEF
Table 19.3 Coefficients
Variables
Coef.
Std. Err.
P > t
UNWS
0.2590903
0.1150423
0.033
a
AR
0.1769154
0.101522
0.093
b
LUREG
11.04218
6.51888
0.102
LUOCC
11.43825
6.525314
0.091
b
LUNEV
11.13357
6.567273
0.102
HDSUN
À8.950086
6.449945
0.177
HDSCOP
À8.93124
6.449612
0.178
HDSOK
À8.996964
6.454805
0.175
HDSND
À8.90876
6.45112
0.179
_cons
À208.6369
414.2019
0.619
Source
SS
Df
MS
Model
275.446008
9
30.605112
Residual
179.106303
26
6.88870395
Total
454.552311
35
12.9872089
Number of obs
36
F(9, 26)
4.44
Prob>F
0.0013
R- squared
0.6060
Adj R- squared
0.4696
Source: Computed data
a Significant at 5%
b
Significant at 10%
398
J. V. Arun and A. Premkumar