

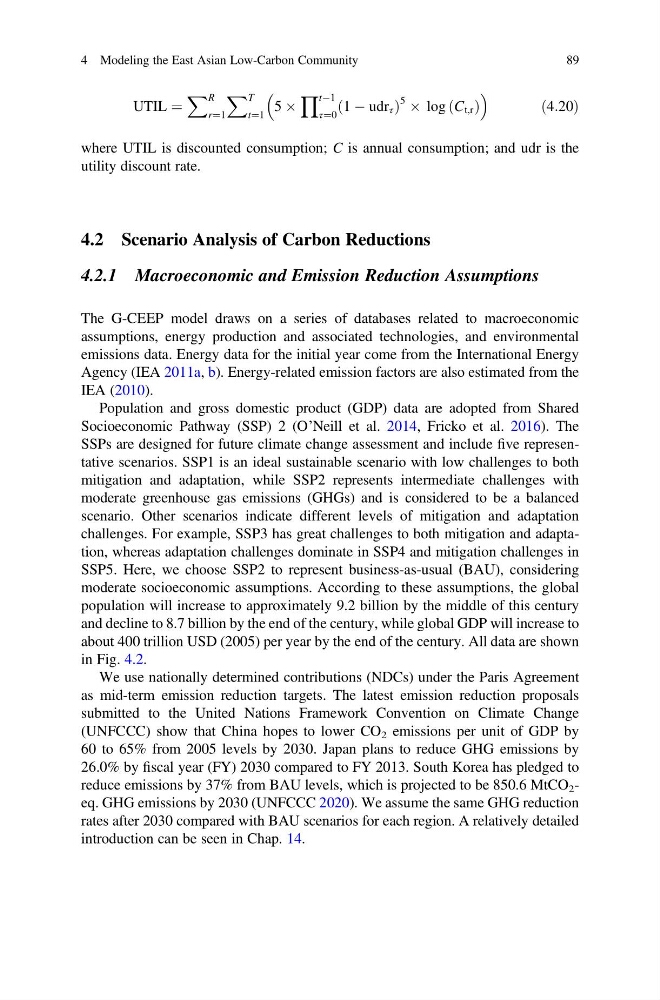
UTIL ¼
X R
r¼1
X T
t¼1
5 Â
Y tÀ1
τ¼0
1 À udr τ
ð
Þ
5 Â log C t,r
ð Þ
ð4:20Þ
where UTIL is discounted consumption; C is annual consumption; and udr is the
utility discount rate.
4.2 Scenario Analysis of Carbon Reductions
4.2.1 Macroeconomic and Emission Reduction Assumptions
The G-CEEP model draws on a series of databases related to macroeconomic
assumptions, energy production and associated technologies, and environmental
emissions data. Energy data for the initial year come from the International Energy
Agency (IEA 2011a, b). Energy-related emission factors are also estimated from the
IEA (2010).
Population and gross domestic product (GDP) data are adopted from Shared
Socioeconomic Pathway (SSP) 2 (O’Neill et al. 2014, Fricko et al. 2016). The
SSPs are designed for future climate change assessment and include five representative scenarios. SSP1 is an ideal sustainable scenario with low challenges to both
mitigation and adaptation, while SSP2 represents intermediate challenges with
moderate greenhouse gas emissions (GHGs) and is considered to be a balanced
scenario. Other scenarios indicate different levels of mitigation and adaptation
challenges. For example, SSP3 has great challenges to both mitigation and adaptation, whereas adaptation challenges dominate in SSP4 and mitigation challenges in
SSP5. Here, we choose SSP2 to represent business-as-usual (BAU), considering
moderate socioeconomic assumptions. According to these assumptions, the global
population will increase to approximately 9.2 billion by the middle of this century
and decline to 8.7 billion by the end of the century, while global GDP will increase to
about 400 trillion USD (2005) per year by the end of the century. All data are shown
in Fig. 4.2.
We use nationally determined contributions (NDCs) under the Paris Agreement
as mid-term emission reduction targets. The latest emission reduction proposals
submitted to the United Nations Framework Convention on Climate Change
(UNFCCC) show that China hopes to lower CO 2 emissions per unit of GDP by
60 to 65% from 2005 levels by 2030. Japan plans to reduce GHG emissions by
26.0% by fiscal year (FY) 2030 compared to FY 2013. South Korea has pledged to
reduce emissions by 37% from BAU levels, which is projected to be 850.6 MtCO 2 -
eq. GHG emissions by 2030 (UNFCCC 2020). We assume the same GHG reduction
rates after 2030 compared with BAU scenarios for each region. A relatively detailed
introduction can be seen in Chap. 14.
4 Modeling the East Asian Low-Carbon Community
89
X R
r¼1
X T
t¼1
5 Â
Y tÀ1
τ¼0
1 À udr τ
ð
Þ
5 Â log C t,r
ð Þ
ð4:20Þ
where UTIL is discounted consumption; C is annual consumption; and udr is the
utility discount rate.
4.2 Scenario Analysis of Carbon Reductions
4.2.1 Macroeconomic and Emission Reduction Assumptions
The G-CEEP model draws on a series of databases related to macroeconomic
assumptions, energy production and associated technologies, and environmental
emissions data. Energy data for the initial year come from the International Energy
Agency (IEA 2011a, b). Energy-related emission factors are also estimated from the
IEA (2010).
Population and gross domestic product (GDP) data are adopted from Shared
Socioeconomic Pathway (SSP) 2 (O’Neill et al. 2014, Fricko et al. 2016). The
SSPs are designed for future climate change assessment and include five representative scenarios. SSP1 is an ideal sustainable scenario with low challenges to both
mitigation and adaptation, while SSP2 represents intermediate challenges with
moderate greenhouse gas emissions (GHGs) and is considered to be a balanced
scenario. Other scenarios indicate different levels of mitigation and adaptation
challenges. For example, SSP3 has great challenges to both mitigation and adaptation, whereas adaptation challenges dominate in SSP4 and mitigation challenges in
SSP5. Here, we choose SSP2 to represent business-as-usual (BAU), considering
moderate socioeconomic assumptions. According to these assumptions, the global
population will increase to approximately 9.2 billion by the middle of this century
and decline to 8.7 billion by the end of the century, while global GDP will increase to
about 400 trillion USD (2005) per year by the end of the century. All data are shown
in Fig. 4.2.
We use nationally determined contributions (NDCs) under the Paris Agreement
as mid-term emission reduction targets. The latest emission reduction proposals
submitted to the United Nations Framework Convention on Climate Change
(UNFCCC) show that China hopes to lower CO 2 emissions per unit of GDP by
60 to 65% from 2005 levels by 2030. Japan plans to reduce GHG emissions by
26.0% by fiscal year (FY) 2030 compared to FY 2013. South Korea has pledged to
reduce emissions by 37% from BAU levels, which is projected to be 850.6 MtCO 2 -
eq. GHG emissions by 2030 (UNFCCC 2020). We assume the same GHG reduction
rates after 2030 compared with BAU scenarios for each region. A relatively detailed
introduction can be seen in Chap. 14.
4 Modeling the East Asian Low-Carbon Community
89