

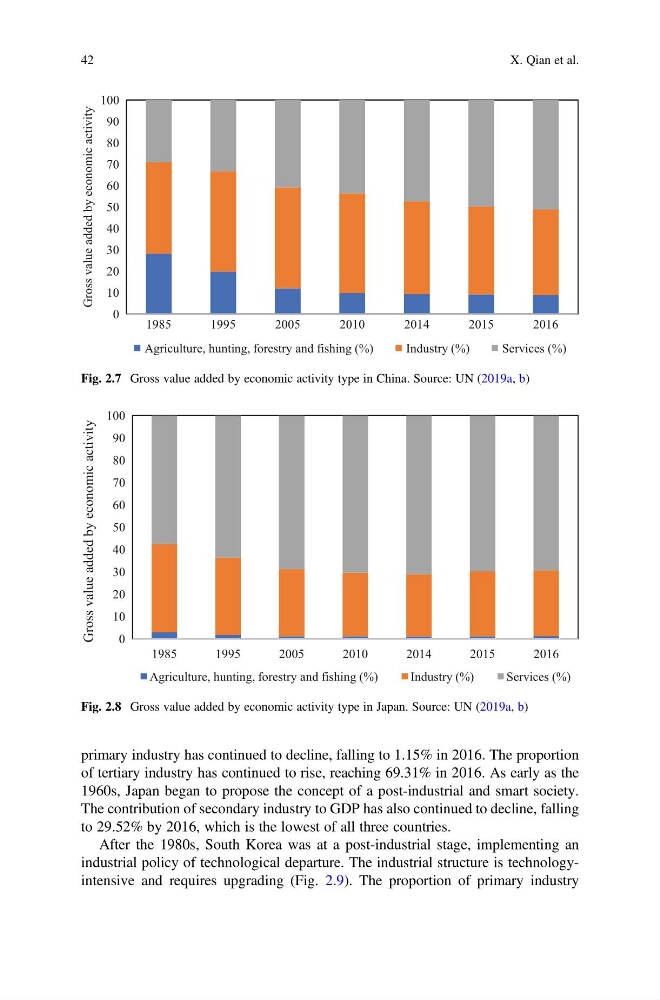
primary industry has continued to decline, falling to 1.15% in 2016. The proportion
of tertiary industry has continued to rise, reaching 69.31% in 2016. As early as the
1960s, Japan began to propose the concept of a post-industrial and smart society.
The contribution of secondary industry to GDP has also continued to decline, falling
to 29.52% by 2016, which is the lowest of all three countries.
After the 1980s, South Korea was at a post-industrial stage, implementing an
industrial policy of technological departure. The industrial structure is technologyintensive and requires upgrading (Fig. 2.9). The proportion of primary industry
0
10
20
30
40
50
60
70
80
90
100
1985
1995
2005
2010
2014
2015
2016
Gross value added by economic activity
Agriculture, hunting, forestry and fishing (%)
Industry (%)
Services (%)
Fig. 2.7 Gross value added by economic activity type in China. Source: UN (2019a, b)
0
10
20
30
40
50
60
70
80
90
100
1985
1995
2005
2010
2014
2015
2016
Gross value added by economic activity
Agriculture, hunting, forestry and fishing (%)
Industry (%)
Services (%)
Fig. 2.8 Gross value added by economic activity type in Japan. Source: UN (2019a, b)
42
X. Qian et al.
of tertiary industry has continued to rise, reaching 69.31% in 2016. As early as the
1960s, Japan began to propose the concept of a post-industrial and smart society.
The contribution of secondary industry to GDP has also continued to decline, falling
to 29.52% by 2016, which is the lowest of all three countries.
After the 1980s, South Korea was at a post-industrial stage, implementing an
industrial policy of technological departure. The industrial structure is technologyintensive and requires upgrading (Fig. 2.9). The proportion of primary industry
0
10
20
30
40
50
60
70
80
90
100
1985
1995
2005
2010
2014
2015
2016
Gross value added by economic activity
Agriculture, hunting, forestry and fishing (%)
Industry (%)
Services (%)
Fig. 2.7 Gross value added by economic activity type in China. Source: UN (2019a, b)
0
10
20
30
40
50
60
70
80
90
100
1985
1995
2005
2010
2014
2015
2016
Gross value added by economic activity
Agriculture, hunting, forestry and fishing (%)
Industry (%)
Services (%)
Fig. 2.8 Gross value added by economic activity type in Japan. Source: UN (2019a, b)
42
X. Qian et al.