

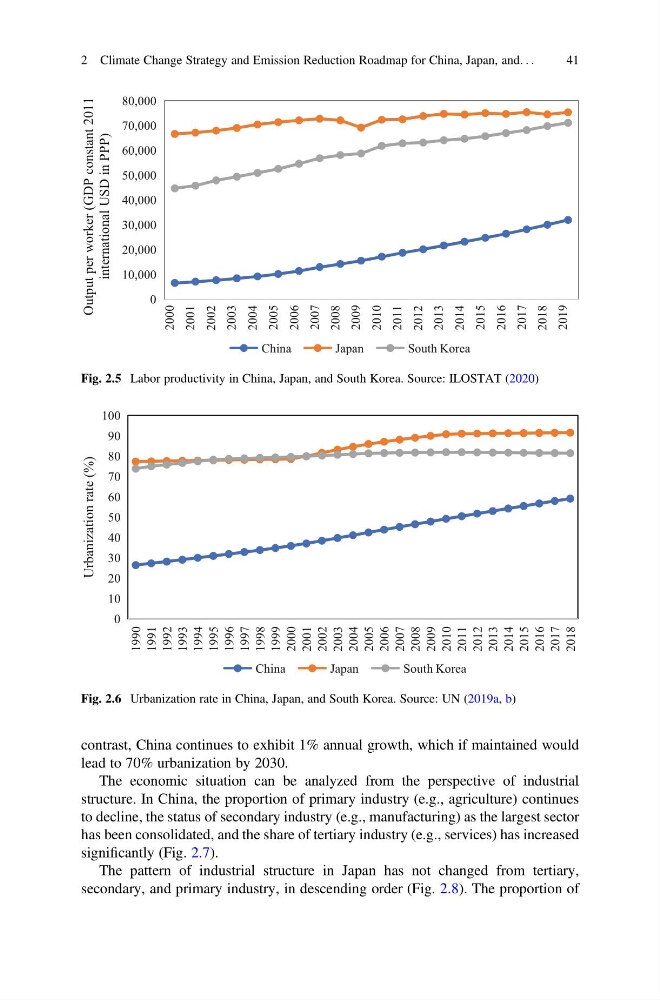
contrast, China continues to exhibit 1% annual growth, which if maintained would
lead to 70% urbanization by 2030.
The economic situation can be analyzed from the perspective of industrial
structure. In China, the proportion of primary industry (e.g., agriculture) continues
to decline, the status of secondary industry (e.g., manufacturing) as the largest sector
has been consolidated, and the share of tertiary industry (e.g., services) has increased
significantly (Fig. 2.7).
The pattern of industrial structure in Japan has not changed from tertiary,
secondary, and primary industry, in descending order (Fig. 2.8). The proportion of
0
10,000
20,000
30,000
40,000
50,000
60,000
70,000
80,000
Output per worker (GDP constant 2011
international USD in PPP)
China
Japan
South Korea
Fig. 2.5 Labor productivity in China, Japan, and South Korea. Source: ILOSTAT (2020)
0
10
20
30
40
50
60
70
80
90
100
1990
1991
1992
1993
1994
1995
1996
1997
1998
1999
2000
2001
2002
2003
2004
2005
2006
2007
2008
2009
2010
2011
2012
2013
2014
2015
2016
2017
2018
Urbanization rate (%)
China
Japan
South Korea
Fig. 2.6 Urbanization rate in China, Japan, and South Korea. Source: UN (2019a, b)
2 Climate Change Strategy and Emission Reduction Roadmap for China, Japan, and. . .
41
lead to 70% urbanization by 2030.
The economic situation can be analyzed from the perspective of industrial
structure. In China, the proportion of primary industry (e.g., agriculture) continues
to decline, the status of secondary industry (e.g., manufacturing) as the largest sector
has been consolidated, and the share of tertiary industry (e.g., services) has increased
significantly (Fig. 2.7).
The pattern of industrial structure in Japan has not changed from tertiary,
secondary, and primary industry, in descending order (Fig. 2.8). The proportion of
0
10,000
20,000
30,000
40,000
50,000
60,000
70,000
80,000
Output per worker (GDP constant 2011
international USD in PPP)
China
Japan
South Korea
Fig. 2.5 Labor productivity in China, Japan, and South Korea. Source: ILOSTAT (2020)
0
10
20
30
40
50
60
70
80
90
100
1990
1991
1992
1993
1994
1995
1996
1997
1998
1999
2000
2001
2002
2003
2004
2005
2006
2007
2008
2009
2010
2011
2012
2013
2014
2015
2016
2017
2018
Urbanization rate (%)
China
Japan
South Korea
Fig. 2.6 Urbanization rate in China, Japan, and South Korea. Source: UN (2019a, b)
2 Climate Change Strategy and Emission Reduction Roadmap for China, Japan, and. . .
41