

growth has only begun to translate into increased productivity in the last 10 years. In
the last 5 years, labor productivity in South Korea has approached that of Japan,
whereas labor productivity in China was approximately 50% that of Japan in 2019.
Urbanization rate provides another means to understand the developmental stages
of the three countries (Fig. 2.6). In 1990, both Japan and South Korea had reached an
urbanization rate of approximately 80%, while China remained at 26%. Since 2010,
the urbanization rate in Japan has stalled at 91% and that of South Korea at 81%. In
0
5,000,000
10,000,000
15,000,000
20,000,000
25,000,000
30,000,000
1990 1992 1994 1996 1998 2000 2002 2004 2006 2008 2010 2012 2014 2016 2018
(GDP) purchasing power parity (PPP) (constant
2011 international billion USD)
China (left scale)
Japan (right scale)
South Korea (right scale)
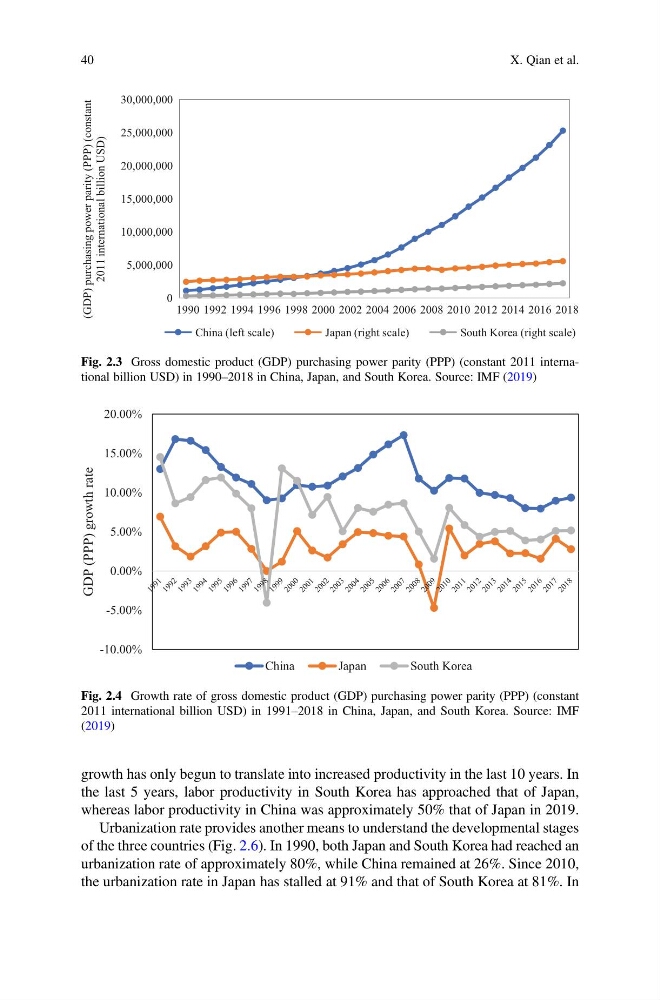
Fig. 2.3 Gross domestic product (GDP) purchasing power parity (PPP) (constant 2011 international billion USD) in 1990–2018 in China, Japan, and South Korea. Source: IMF (2019)
-10.00%
-5.00%
0.00%
5.00%
10.00%
15.00%
20.00%
GDP (PPP) growth rate
China
Japan
South Korea
Fig. 2.4 Growth rate of gross domestic product (GDP) purchasing power parity (PPP) (constant
2011 international billion USD) in 1991–2018 in China, Japan, and South Korea. Source: IMF
(2019)
40
X. Qian et al.
the last 5 years, labor productivity in South Korea has approached that of Japan,
whereas labor productivity in China was approximately 50% that of Japan in 2019.
Urbanization rate provides another means to understand the developmental stages
of the three countries (Fig. 2.6). In 1990, both Japan and South Korea had reached an
urbanization rate of approximately 80%, while China remained at 26%. Since 2010,
the urbanization rate in Japan has stalled at 91% and that of South Korea at 81%. In
0
5,000,000
10,000,000
15,000,000
20,000,000
25,000,000
30,000,000
1990 1992 1994 1996 1998 2000 2002 2004 2006 2008 2010 2012 2014 2016 2018
(GDP) purchasing power parity (PPP) (constant
2011 international billion USD)
China (left scale)
Japan (right scale)
South Korea (right scale)
Fig. 2.3 Gross domestic product (GDP) purchasing power parity (PPP) (constant 2011 international billion USD) in 1990–2018 in China, Japan, and South Korea. Source: IMF (2019)
-10.00%
-5.00%
0.00%
5.00%
10.00%
15.00%
20.00%
GDP (PPP) growth rate
China
Japan
South Korea
Fig. 2.4 Growth rate of gross domestic product (GDP) purchasing power parity (PPP) (constant
2011 international billion USD) in 1991–2018 in China, Japan, and South Korea. Source: IMF
(2019)
40
X. Qian et al.