

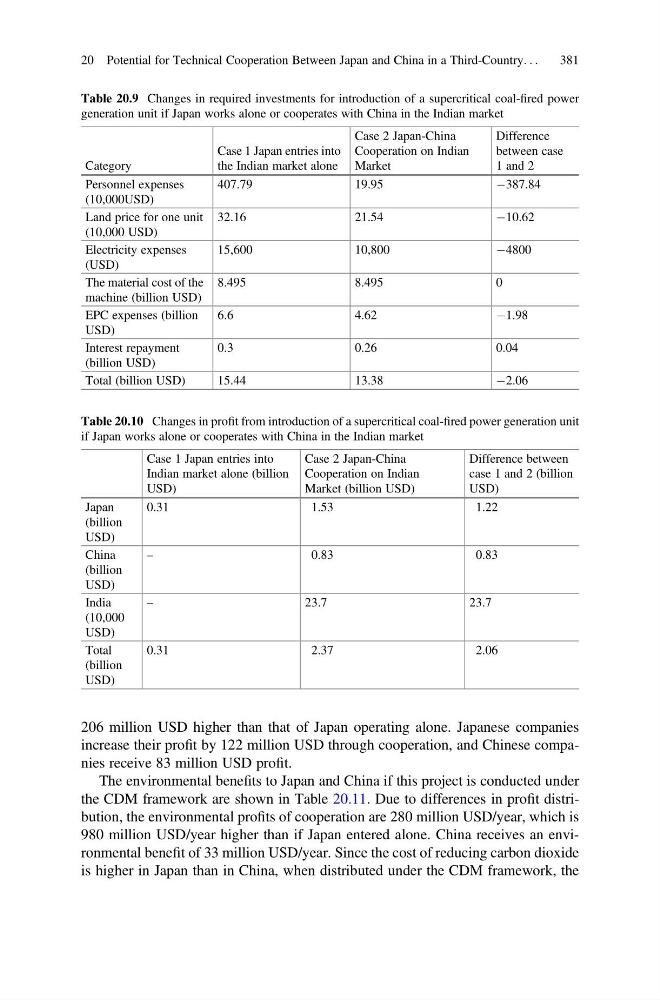
206 million USD higher than that of Japan operating alone. Japanese companies
increase their profit by 122 million USD through cooperation, and Chinese companies receive 83 million USD profit.
The environmental benefits to Japan and China if this project is conducted under
the CDM framework are shown in Table 20.11. Due to differences in profit distribution, the environmental profits of cooperation are 280 million USD/year, which is
980 million USD/year higher than if Japan entered alone. China receives an environmental benefit of 33 million USD/year. Since the cost of reducing carbon dioxide
is higher in Japan than in China, when distributed under the CDM framework, the
Table 20.9 Changes in required investments for introduction of a supercritical coal-fired power
generation unit if Japan works alone or cooperates with China in the Indian market
Category
Case 1 Japan entries into
the Indian market alone
Case 2 Japan-China
Cooperation on Indian
Market
Difference
between case
1 and 2
Personnel expenses
(10,000USD)
407.79
19.95
À387.84
Land price for one unit
(10,000 USD)
32.16
21.54
À10.62
Electricity expenses
(USD)
15,600
10,800
À4800
The material cost of the
machine (billion USD)
8.495
8.495
0
EPC expenses (billion
USD)
6.6
4.62
À1.98
Interest repayment
(billion USD)
0.3
0.26
0.04
Total (billion USD)
15.44
13.38
À2.06
Table 20.10 Changes in profit from introduction of a supercritical coal-fired power generation unit
if Japan works alone or cooperates with China in the Indian market
Case 1 Japan entries into
Indian market alone (billion
USD)
Case 2 Japan-China
Cooperation on Indian
Market (billion USD)
Difference between
case 1 and 2 (billion
USD)
Japan
(billion
USD)
0.31
1.53
1.22
China
(billion
USD)
–
0.83
0.83
India
(10,000
USD)
–
23.7
23.7
Total
(billion
USD)
0.31
2.37
2.06
20 Potential for Technical Cooperation Between Japan and China in a Third-Country. . .
381
increase their profit by 122 million USD through cooperation, and Chinese companies receive 83 million USD profit.
The environmental benefits to Japan and China if this project is conducted under
the CDM framework are shown in Table 20.11. Due to differences in profit distribution, the environmental profits of cooperation are 280 million USD/year, which is
980 million USD/year higher than if Japan entered alone. China receives an environmental benefit of 33 million USD/year. Since the cost of reducing carbon dioxide
is higher in Japan than in China, when distributed under the CDM framework, the
Table 20.9 Changes in required investments for introduction of a supercritical coal-fired power
generation unit if Japan works alone or cooperates with China in the Indian market
Category
Case 1 Japan entries into
the Indian market alone
Case 2 Japan-China
Cooperation on Indian
Market
Difference
between case
1 and 2
Personnel expenses
(10,000USD)
407.79
19.95
À387.84
Land price for one unit
(10,000 USD)
32.16
21.54
À10.62
Electricity expenses
(USD)
15,600
10,800
À4800
The material cost of the
machine (billion USD)
8.495
8.495
0
EPC expenses (billion
USD)
6.6
4.62
À1.98
Interest repayment
(billion USD)
0.3
0.26
0.04
Total (billion USD)
15.44
13.38
À2.06
Table 20.10 Changes in profit from introduction of a supercritical coal-fired power generation unit
if Japan works alone or cooperates with China in the Indian market
Case 1 Japan entries into
Indian market alone (billion
USD)
Case 2 Japan-China
Cooperation on Indian
Market (billion USD)
Difference between
case 1 and 2 (billion
USD)
Japan
(billion
USD)
0.31
1.53
1.22
China
(billion
USD)
–
0.83
0.83
India
(10,000
USD)
–
23.7
23.7
Total
(billion
USD)
0.31
2.37
2.06
20 Potential for Technical Cooperation Between Japan and China in a Third-Country. . .
381