

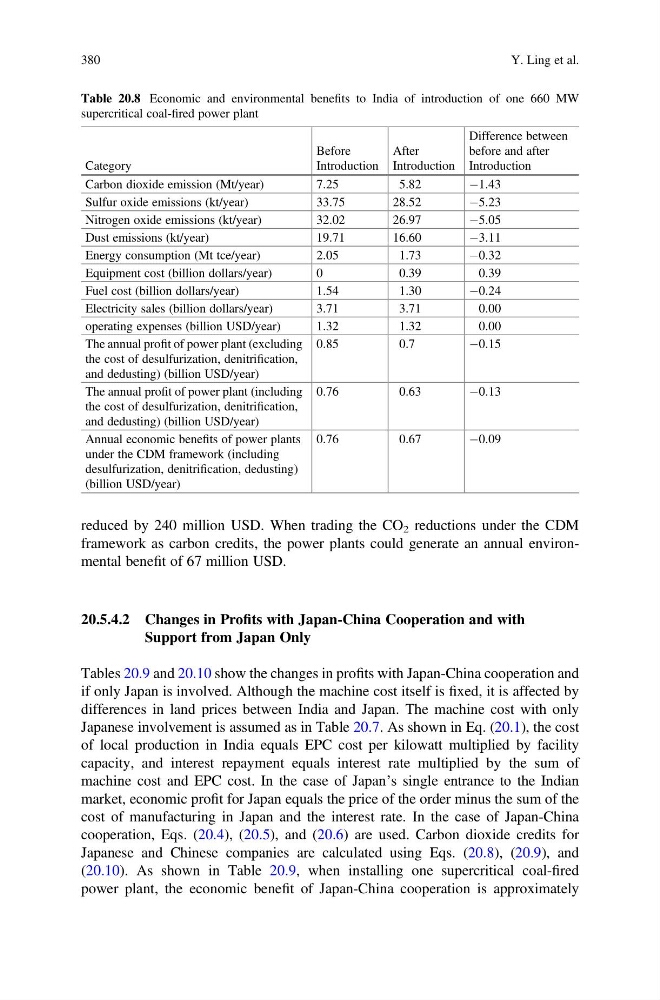
reduced by 240 million USD. When trading the CO 2 reductions under the CDM
framework as carbon credits, the power plants could generate an annual environmental benefit of 67 million USD.
20.5.4.2 Changes in Profits with Japan-China Cooperation and with
Support from Japan Only
Tables 20.9 and 20.10 show the changes in profits with Japan-China cooperation and
if only Japan is involved. Although the machine cost itself is fixed, it is affected by
differences in land prices between India and Japan. The machine cost with only
Japanese involvement is assumed as in Table 20.7. As shown in Eq. (20.1), the cost
of local production in India equals EPC cost per kilowatt multiplied by facility
capacity, and interest repayment equals interest rate multiplied by the sum of
machine cost and EPC cost. In the case of Japan’s single entrance to the Indian
market, economic profit for Japan equals the price of the order minus the sum of the
cost of manufacturing in Japan and the interest rate. In the case of Japan-China
cooperation, Eqs. (20.4), (20.5), and (20.6) are used. Carbon dioxide credits for
Japanese and Chinese companies are calculated using Eqs. (20.8), (20.9), and
(20.10). As shown in Table 20.9, when installing one supercritical coal-fired
power plant, the economic benefit of Japan-China cooperation is approximately
Table 20.8 Economic and environmental benefits to India of introduction of one 660 MW
supercritical coal-fired power plant
Category
Before
Introduction
After
Introduction
Difference between
before and after
Introduction
Carbon dioxide emission (Mt/year)
7.25
5.82
À1.43
Sulfur oxide emissions (kt/year)
33.75
28.52
À5.23
Nitrogen oxide emissions (kt/year)
32.02
26.97
À5.05
Dust emissions (kt/year)
19.71
16.60
À3.11
Energy consumption (Mt tce/year)
2.05
1.73
À0.32
Equipment cost (billion dollars/year)
0
0.39
0.39
Fuel cost (billion dollars/year)
1.54
1.30
À0.24
Electricity sales (billion dollars/year)
3.71
3.71
0.00
operating expenses (billion USD/year)
1.32
1.32
0.00
The annual profit of power plant (excluding
the cost of desulfurization, denitrification,
and dedusting) (billion USD/year)
0.85
0.7
À0.15
The annual profit of power plant (including
the cost of desulfurization, denitrification,
and dedusting) (billion USD/year)
0.76
0.63
À0.13
Annual economic benefits of power plants
under the CDM framework (including
desulfurization, denitrification, dedusting)
(billion USD/year)
0.76
0.67
À0.09
380
Y. Ling et al.
framework as carbon credits, the power plants could generate an annual environmental benefit of 67 million USD.
20.5.4.2 Changes in Profits with Japan-China Cooperation and with
Support from Japan Only
Tables 20.9 and 20.10 show the changes in profits with Japan-China cooperation and
if only Japan is involved. Although the machine cost itself is fixed, it is affected by
differences in land prices between India and Japan. The machine cost with only
Japanese involvement is assumed as in Table 20.7. As shown in Eq. (20.1), the cost
of local production in India equals EPC cost per kilowatt multiplied by facility
capacity, and interest repayment equals interest rate multiplied by the sum of
machine cost and EPC cost. In the case of Japan’s single entrance to the Indian
market, economic profit for Japan equals the price of the order minus the sum of the
cost of manufacturing in Japan and the interest rate. In the case of Japan-China
cooperation, Eqs. (20.4), (20.5), and (20.6) are used. Carbon dioxide credits for
Japanese and Chinese companies are calculated using Eqs. (20.8), (20.9), and
(20.10). As shown in Table 20.9, when installing one supercritical coal-fired
power plant, the economic benefit of Japan-China cooperation is approximately
Table 20.8 Economic and environmental benefits to India of introduction of one 660 MW
supercritical coal-fired power plant
Category
Before
Introduction
After
Introduction
Difference between
before and after
Introduction
Carbon dioxide emission (Mt/year)
7.25
5.82
À1.43
Sulfur oxide emissions (kt/year)
33.75
28.52
À5.23
Nitrogen oxide emissions (kt/year)
32.02
26.97
À5.05
Dust emissions (kt/year)
19.71
16.60
À3.11
Energy consumption (Mt tce/year)
2.05
1.73
À0.32
Equipment cost (billion dollars/year)
0
0.39
0.39
Fuel cost (billion dollars/year)
1.54
1.30
À0.24
Electricity sales (billion dollars/year)
3.71
3.71
0.00
operating expenses (billion USD/year)
1.32
1.32
0.00
The annual profit of power plant (excluding
the cost of desulfurization, denitrification,
and dedusting) (billion USD/year)
0.85
0.7
À0.15
The annual profit of power plant (including
the cost of desulfurization, denitrification,
and dedusting) (billion USD/year)
0.76
0.63
À0.13
Annual economic benefits of power plants
under the CDM framework (including
desulfurization, denitrification, dedusting)
(billion USD/year)
0.76
0.67
À0.09
380
Y. Ling et al.