

20.3.3 Reduction Potential of Thermal Power Generation
Projects in India and Russia
20.3.3.1 Overview of Thermal Power Generation in India and Russia
The CO 2 emission and energy consumption intensities of India and Russia are
significantly higher than those of Japan and are influenced by energy utilization
efficiency, industrial structure, and energy structure. Here, we focus on energy
efficiency, of which power generation efficiency is an essential factor. Both India
and Russia have a high proportion of thermal power generation. Therefore, we
calculated the economic, environmental, and energy benefits to India and Russia if
they were to reach the power generation efficiency of Japan (Fig. 20.3).
Prior to 2011, Japan has the highest thermal power generation among the three
countries. However, following rapid development in India, its thermal power generation began to exceed that in Japan from 2011. In India’s Twelfth Five-Year Plan
(2012–2017), supercritical pressure coal-fired power generation accounts for 39% of
new coal and lignite-fired power generation. Thermal power generation has been
promoted and supported by the Japanese government, especially since the 2011
Fukushima nuclear accident. Natural gas power generation has replaced nuclear
power generation, leading to a 3% increase in power generation efficiency in Japan.
Power generation efficiency in India, which has received support, has also improved.
In contrast, due to the impact of the Lehman Shock in 2008, a shale gas revolution in
2011, and economic sanctions from the United States in 2014, domestic power
generation in Russia has remained unchanged, and power generation efficiency
has not improved.
0
500
1000
1500
2000
1992
1993
1994
1995
1996
1997
1998
1999
2000
2001
2002
2003
2004
2005
2006
2007
2008
2009
2010
2011
2012
2013
2014
Primay energy consumption (Mt)
Reduction in primary energy consumption in India and Russia when matching China
Primary energy consumption in India and Russia when matching Japan
Primary energy consumption in India and Russia
Primary energy consumption in India and Russia when matching Japan
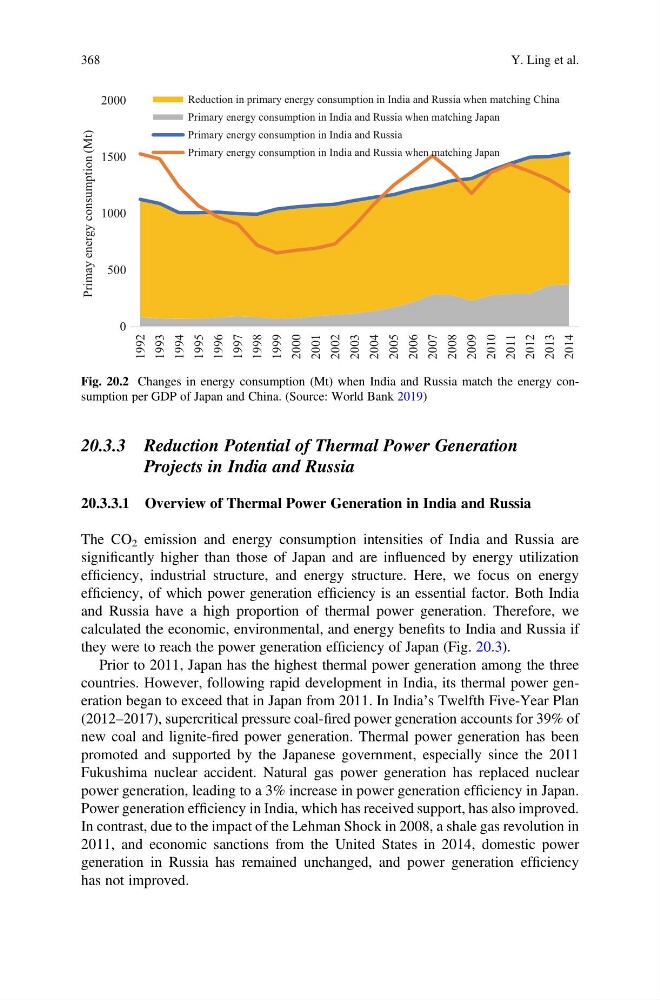
Fig. 20.2 Changes in energy consumption (Mt) when India and Russia match the energy consumption per GDP of Japan and China. (Source: World Bank 2019)
368
Y. Ling et al.
Projects in India and Russia
20.3.3.1 Overview of Thermal Power Generation in India and Russia
The CO 2 emission and energy consumption intensities of India and Russia are
significantly higher than those of Japan and are influenced by energy utilization
efficiency, industrial structure, and energy structure. Here, we focus on energy
efficiency, of which power generation efficiency is an essential factor. Both India
and Russia have a high proportion of thermal power generation. Therefore, we
calculated the economic, environmental, and energy benefits to India and Russia if
they were to reach the power generation efficiency of Japan (Fig. 20.3).
Prior to 2011, Japan has the highest thermal power generation among the three
countries. However, following rapid development in India, its thermal power generation began to exceed that in Japan from 2011. In India’s Twelfth Five-Year Plan
(2012–2017), supercritical pressure coal-fired power generation accounts for 39% of
new coal and lignite-fired power generation. Thermal power generation has been
promoted and supported by the Japanese government, especially since the 2011
Fukushima nuclear accident. Natural gas power generation has replaced nuclear
power generation, leading to a 3% increase in power generation efficiency in Japan.
Power generation efficiency in India, which has received support, has also improved.
In contrast, due to the impact of the Lehman Shock in 2008, a shale gas revolution in
2011, and economic sanctions from the United States in 2014, domestic power
generation in Russia has remained unchanged, and power generation efficiency
has not improved.
0
500
1000
1500
2000
1992
1993
1994
1995
1996
1997
1998
1999
2000
2001
2002
2003
2004
2005
2006
2007
2008
2009
2010
2011
2012
2013
2014
Primay energy consumption (Mt)
Reduction in primary energy consumption in India and Russia when matching China
Primary energy consumption in India and Russia when matching Japan
Primary energy consumption in India and Russia
Primary energy consumption in India and Russia when matching Japan
Fig. 20.2 Changes in energy consumption (Mt) when India and Russia match the energy consumption per GDP of Japan and China. (Source: World Bank 2019)
368
Y. Ling et al.