

20.3.2 Calculating Overall Reduction Potentials for India
and Russia
As described in Sect. 20.3.1, India has the potential to reduce both energy consumption per GDP and CO 2 emissions per GDP if they match the levels of these in Japan
and China. Russia could reduce energy consumption per GDP by matching that in
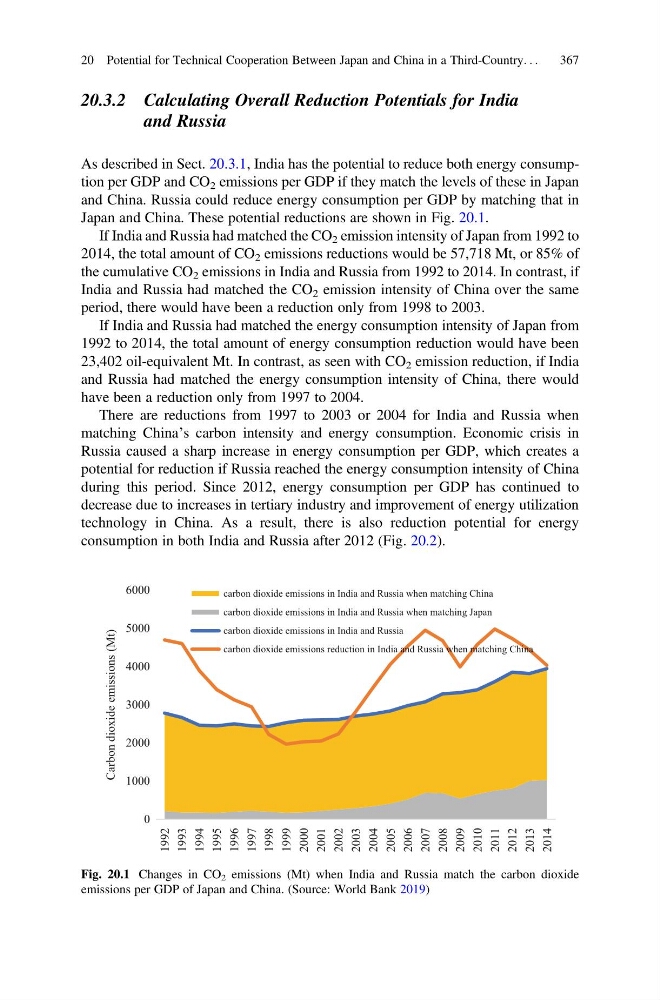
Japan and China. These potential reductions are shown in Fig. 20.1.
If India and Russia had matched the CO 2 emission intensity of Japan from 1992 to
2014, the total amount of CO 2 emissions reductions would be 57,718 Mt, or 85% of
the cumulative CO 2 emissions in India and Russia from 1992 to 2014. In contrast, if
India and Russia had matched the CO 2 emission intensity of China over the same
period, there would have been a reduction only from 1998 to 2003.
If India and Russia had matched the energy consumption intensity of Japan from
1992 to 2014, the total amount of energy consumption reduction would have been
23,402 oil-equivalent Mt. In contrast, as seen with CO 2 emission reduction, if India
and Russia had matched the energy consumption intensity of China, there would
have been a reduction only from 1997 to 2004.
There are reductions from 1997 to 2003 or 2004 for India and Russia when
matching China’s carbon intensity and energy consumption. Economic crisis in
Russia caused a sharp increase in energy consumption per GDP, which creates a
potential for reduction if Russia reached the energy consumption intensity of China
during this period. Since 2012, energy consumption per GDP has continued to
decrease due to increases in tertiary industry and improvement of energy utilization
technology in China. As a result, there is also reduction potential for energy
consumption in both India and Russia after 2012 (Fig. 20.2).
0
1000
2000
3000
4000
5000
6000
1992
1993
1994
1995
1996
1997
1998
1999
2000
2001
2002
2003
2004
2005
2006
2007
2008
2009
2010
2011
2012
2013
2014
Carbon dioxide emissions (Mt)
carbon dioxide emissions in India and Russia when matching China
carbon dioxide emissions in India and Russia when matching Japan
carbon dioxide emissions in India and Russia
carbon dioxide emissions reduction in India and Russia when matching China
Fig. 20.1 Changes in CO 2 emissions (Mt) when India and Russia match the carbon dioxide
emissions per GDP of Japan and China. (Source: World Bank 2019)
20 Potential for Technical Cooperation Between Japan and China in a Third-Country. . .
367
and Russia
As described in Sect. 20.3.1, India has the potential to reduce both energy consumption per GDP and CO 2 emissions per GDP if they match the levels of these in Japan
and China. Russia could reduce energy consumption per GDP by matching that in
Japan and China. These potential reductions are shown in Fig. 20.1.
If India and Russia had matched the CO 2 emission intensity of Japan from 1992 to
2014, the total amount of CO 2 emissions reductions would be 57,718 Mt, or 85% of
the cumulative CO 2 emissions in India and Russia from 1992 to 2014. In contrast, if
India and Russia had matched the CO 2 emission intensity of China over the same
period, there would have been a reduction only from 1998 to 2003.
If India and Russia had matched the energy consumption intensity of Japan from
1992 to 2014, the total amount of energy consumption reduction would have been
23,402 oil-equivalent Mt. In contrast, as seen with CO 2 emission reduction, if India
and Russia had matched the energy consumption intensity of China, there would
have been a reduction only from 1997 to 2004.
There are reductions from 1997 to 2003 or 2004 for India and Russia when
matching China’s carbon intensity and energy consumption. Economic crisis in
Russia caused a sharp increase in energy consumption per GDP, which creates a
potential for reduction if Russia reached the energy consumption intensity of China
during this period. Since 2012, energy consumption per GDP has continued to
decrease due to increases in tertiary industry and improvement of energy utilization
technology in China. As a result, there is also reduction potential for energy
consumption in both India and Russia after 2012 (Fig. 20.2).
0
1000
2000
3000
4000
5000
6000
1992
1993
1994
1995
1996
1997
1998
1999
2000
2001
2002
2003
2004
2005
2006
2007
2008
2009
2010
2011
2012
2013
2014
Carbon dioxide emissions (Mt)
carbon dioxide emissions in India and Russia when matching China
carbon dioxide emissions in India and Russia when matching Japan
carbon dioxide emissions in India and Russia
carbon dioxide emissions reduction in India and Russia when matching China
Fig. 20.1 Changes in CO 2 emissions (Mt) when India and Russia match the carbon dioxide
emissions per GDP of Japan and China. (Source: World Bank 2019)
20 Potential for Technical Cooperation Between Japan and China in a Third-Country. . .
367