

20.3 Potential Outcomes in India and Russia
of Cooperation in Energy and the Environment with
China and Japan
20.3.1 Economic and Energy Profiles of Japan, China, India,
and Russia
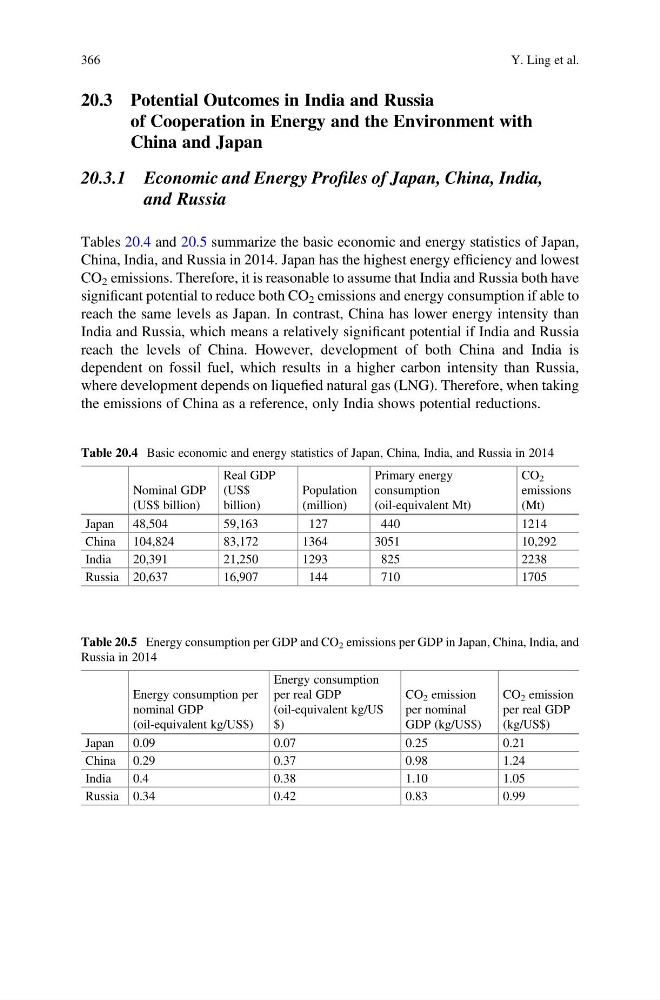
Tables 20.4 and 20.5 summarize the basic economic and energy statistics of Japan,
China, India, and Russia in 2014. Japan has the highest energy efficiency and lowest
CO 2 emissions. Therefore, it is reasonable to assume that India and Russia both have
significant potential to reduce both CO 2 emissions and energy consumption if able to
reach the same levels as Japan. In contrast, China has lower energy intensity than
India and Russia, which means a relatively significant potential if India and Russia
reach the levels of China. However, development of both China and India is
dependent on fossil fuel, which results in a higher carbon intensity than Russia,
where development depends on liquefied natural gas (LNG). Therefore, when taking
the emissions of China as a reference, only India shows potential reductions.
Table 20.4 Basic economic and energy statistics of Japan, China, India, and Russia in 2014
Nominal GDP
(US$ billion)
Real GDP
(US$
billion)
Population
(million)
Primary energy
consumption
(oil-equivalent Mt)
CO 2
emissions
(Mt)
Japan 48,504
59,163
127
440
1214
China 104,824
83,172
1364
3051
10,292
India
20,391
21,250
1293
825
2238
Russia 20,637
16,907
144
710
1705
Table 20.5 Energy consumption per GDP and CO 2 emissions per GDP in Japan, China, India, and
Russia in 2014
Energy consumption per
nominal GDP
(oil-equivalent kg/US$)
Energy consumption
per real GDP
(oil-equivalent kg/US
$)
CO 2 emission
per nominal
GDP (kg/US$)
CO 2 emission
per real GDP
(kg/US$)
Japan 0.09
0.07
0.25
0.21
China 0.29
0.37
0.98
1.24
India
0.4
0.38
1.10
1.05
Russia 0.34
0.42
0.83
0.99
366
Y. Ling et al.
of Cooperation in Energy and the Environment with
China and Japan
20.3.1 Economic and Energy Profiles of Japan, China, India,
and Russia
Tables 20.4 and 20.5 summarize the basic economic and energy statistics of Japan,
China, India, and Russia in 2014. Japan has the highest energy efficiency and lowest
CO 2 emissions. Therefore, it is reasonable to assume that India and Russia both have
significant potential to reduce both CO 2 emissions and energy consumption if able to
reach the same levels as Japan. In contrast, China has lower energy intensity than
India and Russia, which means a relatively significant potential if India and Russia
reach the levels of China. However, development of both China and India is
dependent on fossil fuel, which results in a higher carbon intensity than Russia,
where development depends on liquefied natural gas (LNG). Therefore, when taking
the emissions of China as a reference, only India shows potential reductions.
Table 20.4 Basic economic and energy statistics of Japan, China, India, and Russia in 2014
Nominal GDP
(US$ billion)
Real GDP
(US$
billion)
Population
(million)
Primary energy
consumption
(oil-equivalent Mt)
CO 2
emissions
(Mt)
Japan 48,504
59,163
127
440
1214
China 104,824
83,172
1364
3051
10,292
India
20,391
21,250
1293
825
2238
Russia 20,637
16,907
144
710
1705
Table 20.5 Energy consumption per GDP and CO 2 emissions per GDP in Japan, China, India, and
Russia in 2014
Energy consumption per
nominal GDP
(oil-equivalent kg/US$)
Energy consumption
per real GDP
(oil-equivalent kg/US
$)
CO 2 emission
per nominal
GDP (kg/US$)
CO 2 emission
per real GDP
(kg/US$)
Japan 0.09
0.07
0.25
0.21
China 0.29
0.37
0.98
1.24
India
0.4
0.38
1.10
1.05
Russia 0.34
0.42
0.83
0.99
366
Y. Ling et al.