

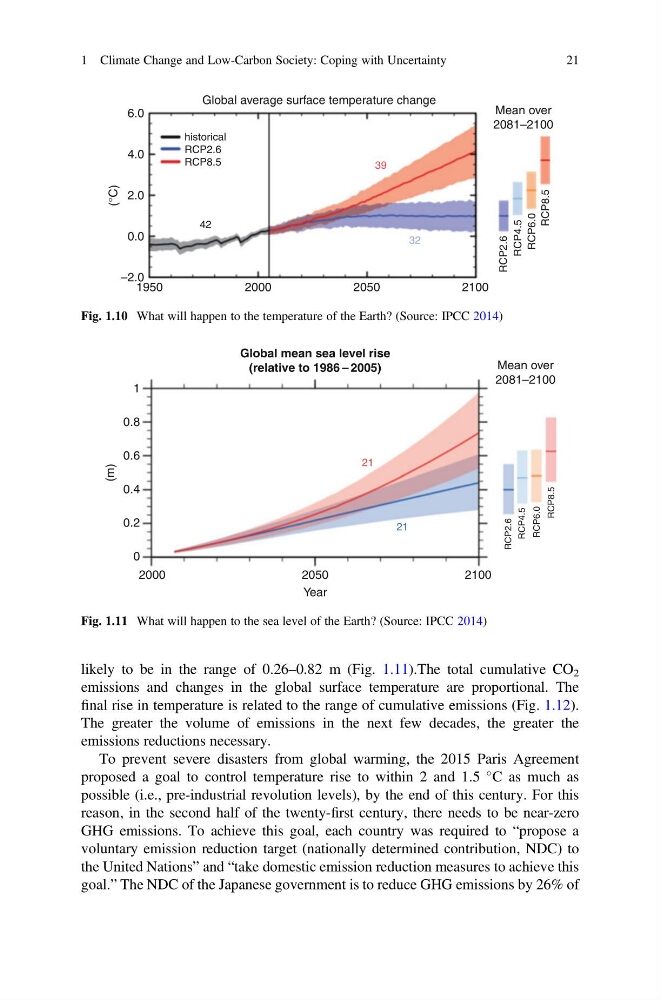
likely to be in the range of 0.26–0.82 m (Fig. 1.11).The total cumulative CO 2
emissions and changes in the global surface temperature are proportional. The
final rise in temperature is related to the range of cumulative emissions (Fig. 1.12).
The greater the volume of emissions in the next few decades, the greater the
emissions reductions necessary.
To prevent severe disasters from global warming, the 2015 Paris Agreement
proposed a goal to control temperature rise to within 2 and 1.5
C as much as
possible (i.e., pre-industrial revolution levels), by the end of this century. For this
reason, in the second half of the twenty-first century, there needs to be near-zero
GHG emissions. To achieve this goal, each country was required to “propose a
voluntary emission reduction target (nationally determined contribution, NDC) to
the United Nations” and “take domestic emission reduction measures to achieve this
goal.” The NDC of the Japanese government is to reduce GHG emissions by 26% of
(°C)
6.0
4.0
2.0
0.0
–2.0
1950
2000
Global average surface temperature change
2050
Mean over
2081–2100
2100
RCP2.6
RCP4.5
historical
RCP2.6
RCP8.5
42
32
39
RCP6.0
RCP8.5
Fig. 1.10 What will happen to the temperature of the Earth? (Source: IPCC 2014)
1
Global mean sea level rise
(relative to 1986 – 2005)
0.8
0.6
(m)
0.4
0.2
0
2000
2050
2100
21
21
RCP2.6
RCP4.5
RCP6.0
RCP8.5
Mean over
2081–2100
Year
Fig. 1.11 What will happen to the sea level of the Earth? (Source: IPCC 2014)
1 Climate Change and Low-Carbon Society: Coping with Uncertainty
21
emissions and changes in the global surface temperature are proportional. The
final rise in temperature is related to the range of cumulative emissions (Fig. 1.12).
The greater the volume of emissions in the next few decades, the greater the
emissions reductions necessary.
To prevent severe disasters from global warming, the 2015 Paris Agreement
proposed a goal to control temperature rise to within 2 and 1.5
C as much as
possible (i.e., pre-industrial revolution levels), by the end of this century. For this
reason, in the second half of the twenty-first century, there needs to be near-zero
GHG emissions. To achieve this goal, each country was required to “propose a
voluntary emission reduction target (nationally determined contribution, NDC) to
the United Nations” and “take domestic emission reduction measures to achieve this
goal.” The NDC of the Japanese government is to reduce GHG emissions by 26% of
(°C)
6.0
4.0
2.0
0.0
–2.0
1950
2000
Global average surface temperature change
2050
Mean over
2081–2100
2100
RCP2.6
RCP4.5
historical
RCP2.6
RCP8.5
42
32
39
RCP6.0
RCP8.5
Fig. 1.10 What will happen to the temperature of the Earth? (Source: IPCC 2014)
1
Global mean sea level rise
(relative to 1986 – 2005)
0.8
0.6
(m)
0.4
0.2
0
2000
2050
2100
21
21
RCP2.6
RCP4.5
RCP6.0
RCP8.5
Mean over
2081–2100
Year
Fig. 1.11 What will happen to the sea level of the Earth? (Source: IPCC 2014)
1 Climate Change and Low-Carbon Society: Coping with Uncertainty
21