

NAFTA is greater than 1 everywhere except in NAFTA itself. With regard to
emissions induced by RoW (especially developing countries), ratios for BRIIAT,
the non-Euro zone, and RoW are greater than 1 and are greater than 2 for East Asia,
NAFTA, and the Euro-zone.
16.5 Discussion
International carbon transfer can be interpreted by examining the results of our
analysis. For example, for transportation equipment, estimated production-based
CO 2 emissions in China are 17,115 kt (17.1 Mt), whereas consumption-based
emissions are 23,099 kt (23.1 Mt). The ratio of consumption-based
8 to productionbased emissions is 0.85, so, approximately 15% of Chinese CO 2 emissions occur as
a result of imports.
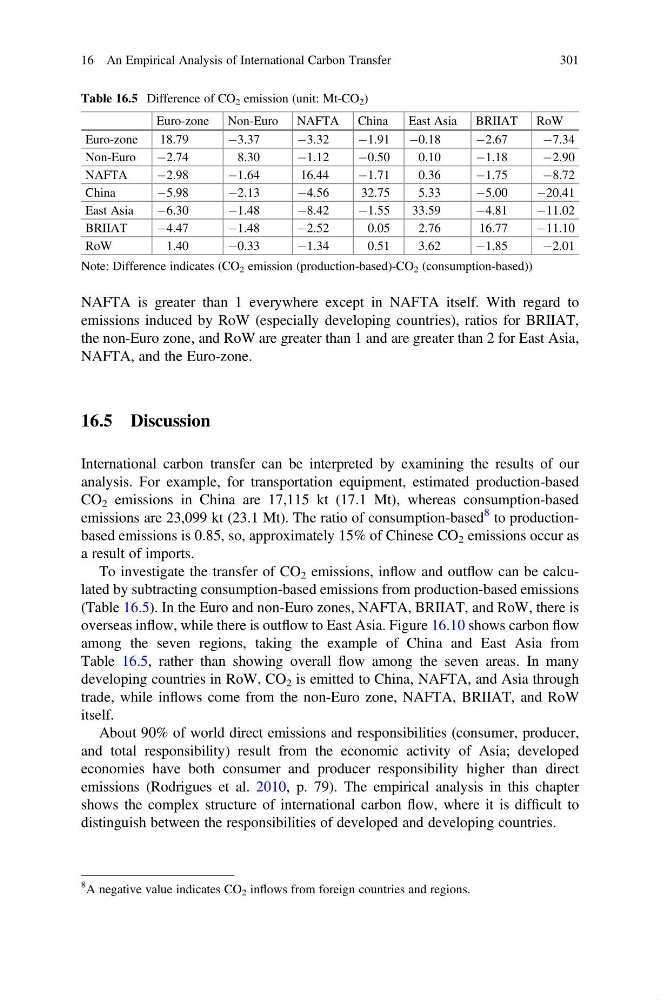
To investigate the transfer of CO 2 emissions, inflow and outflow can be calculated by subtracting consumption-based emissions from production-based emissions
(Table 16.5). In the Euro and non-Euro zones, NAFTA, BRIIAT, and RoW, there is
overseas inflow, while there is outflow to East Asia. Figure 16.10 shows carbon flow
among the seven regions, taking the example of China and East Asia from
Table 16.5, rather than showing overall flow among the seven areas. In many
developing countries in RoW, CO 2 is emitted to China, NAFTA, and Asia through
trade, while inflows come from the non-Euro zone, NAFTA, BRIIAT, and RoW
itself.
About 90% of world direct emissions and responsibilities (consumer, producer,
and total responsibility) result from the economic activity of Asia; developed
economies have both consumer and producer responsibility higher than direct
emissions (Rodrigues et al. 2010, p. 79). The empirical analysis in this chapter
shows the complex structure of international carbon flow, where it is difficult to
distinguish between the responsibilities of developed and developing countries.
Table 16.5 Difference of CO 2 emission (unit: Mt-CO 2 )
Euro-zone Non-Euro NAFTA China
East Asia BRIIAT RoW
Euro-zone
18.79
À3.37
À3.32
À1.91 À0.18
À2.67
À7.34
Non-Euro
À2.74
8.30
À1.12
À0.50
0.10
À1.18
À2.90
NAFTA
À2.98
À1.64
16.44
À1.71
0.36
À1.75
À8.72
China
À5.98
À2.13
À4.56
32.75
5.33
À5.00
À20.41
East Asia
À6.30
À1.48
À8.42
À1.55
33.59
À4.81
À11.02
BRIIAT
À4.47
À1.48
À2.52
0.05
2.76
16.77
À11.10
RoW
1.40
À0.33
À1.34
0.51
3.62
À1.85
À2.01
Note: Difference indicates (CO 2 emission (production-based)-CO 2 (consumption-based))
8 A negative value indicates CO 2 inflows from foreign countries and regions.
16 An Empirical Analysis of International Carbon Transfer
301
emissions induced by RoW (especially developing countries), ratios for BRIIAT,
the non-Euro zone, and RoW are greater than 1 and are greater than 2 for East Asia,
NAFTA, and the Euro-zone.
16.5 Discussion
International carbon transfer can be interpreted by examining the results of our
analysis. For example, for transportation equipment, estimated production-based
CO 2 emissions in China are 17,115 kt (17.1 Mt), whereas consumption-based
emissions are 23,099 kt (23.1 Mt). The ratio of consumption-based
8 to productionbased emissions is 0.85, so, approximately 15% of Chinese CO 2 emissions occur as
a result of imports.
To investigate the transfer of CO 2 emissions, inflow and outflow can be calculated by subtracting consumption-based emissions from production-based emissions
(Table 16.5). In the Euro and non-Euro zones, NAFTA, BRIIAT, and RoW, there is
overseas inflow, while there is outflow to East Asia. Figure 16.10 shows carbon flow
among the seven regions, taking the example of China and East Asia from
Table 16.5, rather than showing overall flow among the seven areas. In many
developing countries in RoW, CO 2 is emitted to China, NAFTA, and Asia through
trade, while inflows come from the non-Euro zone, NAFTA, BRIIAT, and RoW
itself.
About 90% of world direct emissions and responsibilities (consumer, producer,
and total responsibility) result from the economic activity of Asia; developed
economies have both consumer and producer responsibility higher than direct
emissions (Rodrigues et al. 2010, p. 79). The empirical analysis in this chapter
shows the complex structure of international carbon flow, where it is difficult to
distinguish between the responsibilities of developed and developing countries.
Table 16.5 Difference of CO 2 emission (unit: Mt-CO 2 )
Euro-zone Non-Euro NAFTA China
East Asia BRIIAT RoW
Euro-zone
18.79
À3.37
À3.32
À1.91 À0.18
À2.67
À7.34
Non-Euro
À2.74
8.30
À1.12
À0.50
0.10
À1.18
À2.90
NAFTA
À2.98
À1.64
16.44
À1.71
0.36
À1.75
À8.72
China
À5.98
À2.13
À4.56
32.75
5.33
À5.00
À20.41
East Asia
À6.30
À1.48
À8.42
À1.55
33.59
À4.81
À11.02
BRIIAT
À4.47
À1.48
À2.52
0.05
2.76
16.77
À11.10
RoW
1.40
À0.33
À1.34
0.51
3.62
À1.85
À2.01
Note: Difference indicates (CO 2 emission (production-based)-CO 2 (consumption-based))
8 A negative value indicates CO 2 inflows from foreign countries and regions.
16 An Empirical Analysis of International Carbon Transfer
301