

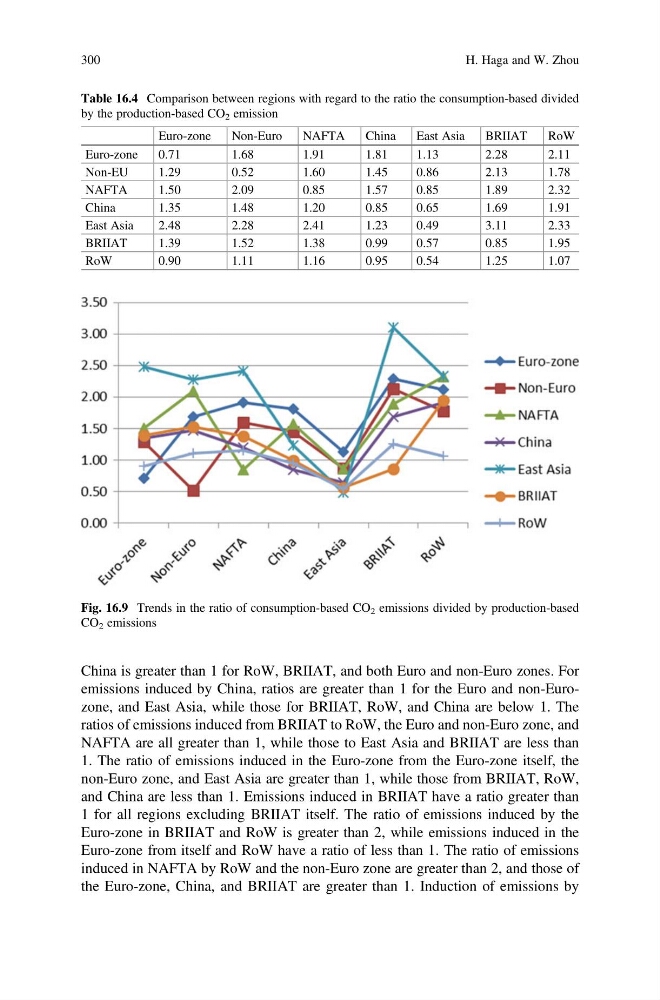
China is greater than 1 for RoW, BRIIAT, and both Euro and non-Euro zones. For
emissions induced by China, ratios are greater than 1 for the Euro and non-Eurozone, and East Asia, while those for BRIIAT, RoW, and China are below 1. The
ratios of emissions induced from BRIIAT to RoW, the Euro and non-Euro zone, and
NAFTA are all greater than 1, while those to East Asia and BRIIAT are less than
1. The ratio of emissions induced in the Euro-zone from the Euro-zone itself, the
non-Euro zone, and East Asia are greater than 1, while those from BRIIAT, RoW,
and China are less than 1. Emissions induced in BRIIAT have a ratio greater than
1 for all regions excluding BRIIAT itself. The ratio of emissions induced by the
Euro-zone in BRIIAT and RoW is greater than 2, while emissions induced in the
Euro-zone from itself and RoW have a ratio of less than 1. The ratio of emissions
induced in NAFTA by RoW and the non-Euro zone are greater than 2, and those of
the Euro-zone, China, and BRIIAT are greater than 1. Induction of emissions by
Table 16.4 Comparison between regions with regard to the ratio the consumption-based divided
by the production-based CO 2 emission
Euro-zone
Non-Euro
NAFTA
China
East Asia
BRIIAT
RoW
Euro-zone
0.71
1.68
1.91
1.81
1.13
2.28
2.11
Non-EU
1.29
0.52
1.60
1.45
0.86
2.13
1.78
NAFTA
1.50
2.09
0.85
1.57
0.85
1.89
2.32
China
1.35
1.48
1.20
0.85
0.65
1.69
1.91
East Asia
2.48
2.28
2.41
1.23
0.49
3.11
2.33
BRIIAT
1.39
1.52
1.38
0.99
0.57
0.85
1.95
RoW
0.90
1.11
1.16
0.95
0.54
1.25
1.07
Fig. 16.9 Trends in the ratio of consumption-based CO 2 emissions divided by production-based
CO 2 emissions
300
H. Haga and W. Zhou
emissions induced by China, ratios are greater than 1 for the Euro and non-Eurozone, and East Asia, while those for BRIIAT, RoW, and China are below 1. The
ratios of emissions induced from BRIIAT to RoW, the Euro and non-Euro zone, and
NAFTA are all greater than 1, while those to East Asia and BRIIAT are less than
1. The ratio of emissions induced in the Euro-zone from the Euro-zone itself, the
non-Euro zone, and East Asia are greater than 1, while those from BRIIAT, RoW,
and China are less than 1. Emissions induced in BRIIAT have a ratio greater than
1 for all regions excluding BRIIAT itself. The ratio of emissions induced by the
Euro-zone in BRIIAT and RoW is greater than 2, while emissions induced in the
Euro-zone from itself and RoW have a ratio of less than 1. The ratio of emissions
induced in NAFTA by RoW and the non-Euro zone are greater than 2, and those of
the Euro-zone, China, and BRIIAT are greater than 1. Induction of emissions by
Table 16.4 Comparison between regions with regard to the ratio the consumption-based divided
by the production-based CO 2 emission
Euro-zone
Non-Euro
NAFTA
China
East Asia
BRIIAT
RoW
Euro-zone
0.71
1.68
1.91
1.81
1.13
2.28
2.11
Non-EU
1.29
0.52
1.60
1.45
0.86
2.13
1.78
NAFTA
1.50
2.09
0.85
1.57
0.85
1.89
2.32
China
1.35
1.48
1.20
0.85
0.65
1.69
1.91
East Asia
2.48
2.28
2.41
1.23
0.49
3.11
2.33
BRIIAT
1.39
1.52
1.38
0.99
0.57
0.85
1.95
RoW
0.90
1.11
1.16
0.95
0.54
1.25
1.07
Fig. 16.9 Trends in the ratio of consumption-based CO 2 emissions divided by production-based
CO 2 emissions
300
H. Haga and W. Zhou