

to demand from NAFTA (91,621 kt CO 2 ), followed by RoW (15,303 kt CO 2 ), and
the Euro-zone (8931 kt CO 2 ).The highest CO 2 emissions induced in China are from
demand in China itself (185,541 kt CO 2 ), followed by NAFTA (27,154 kt CO 2 ).
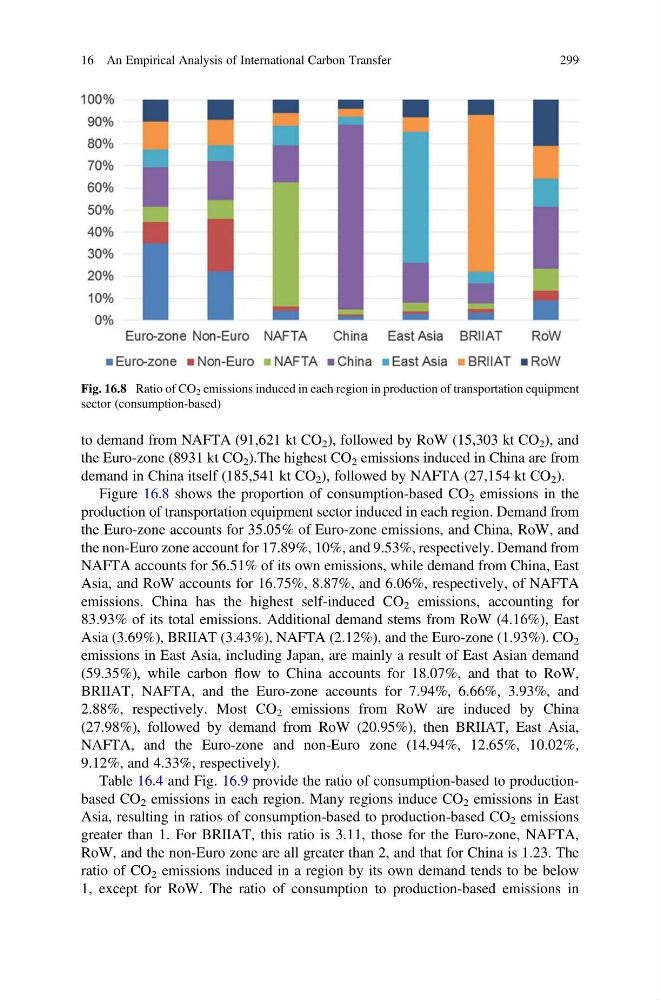
Figure 16.8 shows the proportion of consumption-based CO 2 emissions in the
production of transportation equipment sector induced in each region. Demand from
the Euro-zone accounts for 35.05% of Euro-zone emissions, and China, RoW, and
the non-Euro zone account for 17.89%, 10%, and 9.53%, respectively. Demand from
NAFTA accounts for 56.51% of its own emissions, while demand from China, East
Asia, and RoW accounts for 16.75%, 8.87%, and 6.06%, respectively, of NAFTA
emissions. China has the highest self-induced CO 2 emissions, accounting for
83.93% of its total emissions. Additional demand stems from RoW (4.16%), East
Asia (3.69%), BRIIAT (3.43%), NAFTA (2.12%), and the Euro-zone (1.93%). CO 2
emissions in East Asia, including Japan, are mainly a result of East Asian demand
(59.35%), while carbon flow to China accounts for 18.07%, and that to RoW,
BRIIAT, NAFTA, and the Euro-zone accounts for 7.94%, 6.66%, 3.93%, and
2.88%, respectively. Most CO 2 emissions from RoW are induced by China
(27.98%), followed by demand from RoW (20.95%), then BRIIAT, East Asia,
NAFTA, and the Euro-zone and non-Euro zone (14.94%, 12.65%, 10.02%,
9.12%, and 4.33%, respectively).
Table 16.4 and Fig. 16.9 provide the ratio of consumption-based to productionbased CO 2 emissions in each region. Many regions induce CO 2 emissions in East
Asia, resulting in ratios of consumption-based to production-based CO 2 emissions
greater than 1. For BRIIAT, this ratio is 3.11, those for the Euro-zone, NAFTA,
RoW, and the non-Euro zone are all greater than 2, and that for China is 1.23. The
ratio of CO 2 emissions induced in a region by its own demand tends to be below
1, except for RoW. The ratio of consumption to production-based emissions in
Fig. 16.8 Ratio of CO 2 emissions induced in each region in production of transportation equipment
sector (consumption-based)
16 An Empirical Analysis of International Carbon Transfer
299
the Euro-zone (8931 kt CO 2 ).The highest CO 2 emissions induced in China are from
demand in China itself (185,541 kt CO 2 ), followed by NAFTA (27,154 kt CO 2 ).
Figure 16.8 shows the proportion of consumption-based CO 2 emissions in the
production of transportation equipment sector induced in each region. Demand from
the Euro-zone accounts for 35.05% of Euro-zone emissions, and China, RoW, and
the non-Euro zone account for 17.89%, 10%, and 9.53%, respectively. Demand from
NAFTA accounts for 56.51% of its own emissions, while demand from China, East
Asia, and RoW accounts for 16.75%, 8.87%, and 6.06%, respectively, of NAFTA
emissions. China has the highest self-induced CO 2 emissions, accounting for
83.93% of its total emissions. Additional demand stems from RoW (4.16%), East
Asia (3.69%), BRIIAT (3.43%), NAFTA (2.12%), and the Euro-zone (1.93%). CO 2
emissions in East Asia, including Japan, are mainly a result of East Asian demand
(59.35%), while carbon flow to China accounts for 18.07%, and that to RoW,
BRIIAT, NAFTA, and the Euro-zone accounts for 7.94%, 6.66%, 3.93%, and
2.88%, respectively. Most CO 2 emissions from RoW are induced by China
(27.98%), followed by demand from RoW (20.95%), then BRIIAT, East Asia,
NAFTA, and the Euro-zone and non-Euro zone (14.94%, 12.65%, 10.02%,
9.12%, and 4.33%, respectively).
Table 16.4 and Fig. 16.9 provide the ratio of consumption-based to productionbased CO 2 emissions in each region. Many regions induce CO 2 emissions in East
Asia, resulting in ratios of consumption-based to production-based CO 2 emissions
greater than 1. For BRIIAT, this ratio is 3.11, those for the Euro-zone, NAFTA,
RoW, and the non-Euro zone are all greater than 2, and that for China is 1.23. The
ratio of CO 2 emissions induced in a region by its own demand tends to be below
1, except for RoW. The ratio of consumption to production-based emissions in
Fig. 16.8 Ratio of CO 2 emissions induced in each region in production of transportation equipment
sector (consumption-based)
16 An Empirical Analysis of International Carbon Transfer
299