

products both for intermediate and final use are split into domestically produced and
imported. The WIOT shows in which foreign industry a product was produced
(Timmer 2012, pp. 4–5). This database has been combined with detailed data on
production activity in each country and international trade to illustrate supply of
59 products and use of 35 industries. “Use” can refer to issues related to fragmentation, socioeconomic aspects (e.g., labor and the creation of added value), and
environmental aspects (e.g., energy use, atmospheric emissions, and water consumption) (Dietzenbacaher et al. 2013, pp. 91–92).
In order to reflect globalization, an effective database for policymaking and
analysis must be global, use time-series data to evaluate previous development,
include several socioeconomic and environmental indicators, and base all data on
a consistent framework (e.g., using the same industrial classification). In this respect,
WIOD is useful for policy analysis.
The core of the environmental database consists of atmospheric emission
accounts. Atmospheric emissions resulting in impact categories covered in the
WIOD (global warming, acidification, and tropospheric ozone formation) originate
from gases emitted in energy use processes. Inventory data from the UNFCCC and
the Convention on Long-Range Transboundary Air Pollution (CLRTAP) are compiled using extended energy balances from the International Energy Agency (IEA)
(Timmer 2012, p. 15). We use CO 2 emissions data from the WIOD 2009 release.
Increasing numbers of studies are using WIOD. For example, Boitier (2012) used
input-output analysis to calculate consumption-based emissions of greenhouse gases
(GHG) and applied this to environmental issues (Leontief 1970). The WIOD
database was used to calculate a consumption-based inventory of national GHG
emissions for 41 countries from 1995 to 2009, which were then compared with
production-based GHG inventories. The structures of CO 2 emissions in the
European Union (Yoshinaga 2013) and Germany (Yoshinaga 2004) have been
analyzed using data from WIOD. The former study examines trends in domestic
and industrial CO 2 emissions in all European Union countries, including Central
European and Baltic countries that joined the European Union in 2005.
16.3.2 Analysis
First, CO 2 emissions were divided into production-based and consumption-based.
The former were considered to be CO 2 emissions from production for which
Industry
Final Use
Total
Industry
Intermediate Use
Domestic
Final Use
Exports
Total
Output
Imports
Value Added
Total Output
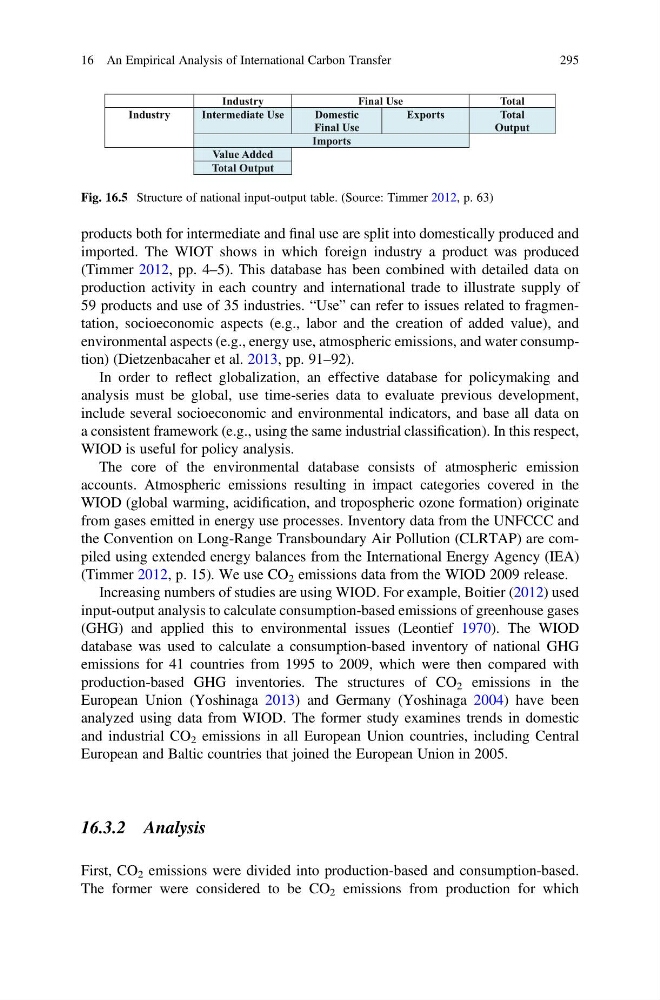
Fig. 16.5 Structure of national input-output table. (Source: Timmer 2012, p. 63)
16 An Empirical Analysis of International Carbon Transfer
295
imported. The WIOT shows in which foreign industry a product was produced
(Timmer 2012, pp. 4–5). This database has been combined with detailed data on
production activity in each country and international trade to illustrate supply of
59 products and use of 35 industries. “Use” can refer to issues related to fragmentation, socioeconomic aspects (e.g., labor and the creation of added value), and
environmental aspects (e.g., energy use, atmospheric emissions, and water consumption) (Dietzenbacaher et al. 2013, pp. 91–92).
In order to reflect globalization, an effective database for policymaking and
analysis must be global, use time-series data to evaluate previous development,
include several socioeconomic and environmental indicators, and base all data on
a consistent framework (e.g., using the same industrial classification). In this respect,
WIOD is useful for policy analysis.
The core of the environmental database consists of atmospheric emission
accounts. Atmospheric emissions resulting in impact categories covered in the
WIOD (global warming, acidification, and tropospheric ozone formation) originate
from gases emitted in energy use processes. Inventory data from the UNFCCC and
the Convention on Long-Range Transboundary Air Pollution (CLRTAP) are compiled using extended energy balances from the International Energy Agency (IEA)
(Timmer 2012, p. 15). We use CO 2 emissions data from the WIOD 2009 release.
Increasing numbers of studies are using WIOD. For example, Boitier (2012) used
input-output analysis to calculate consumption-based emissions of greenhouse gases
(GHG) and applied this to environmental issues (Leontief 1970). The WIOD
database was used to calculate a consumption-based inventory of national GHG
emissions for 41 countries from 1995 to 2009, which were then compared with
production-based GHG inventories. The structures of CO 2 emissions in the
European Union (Yoshinaga 2013) and Germany (Yoshinaga 2004) have been
analyzed using data from WIOD. The former study examines trends in domestic
and industrial CO 2 emissions in all European Union countries, including Central
European and Baltic countries that joined the European Union in 2005.
16.3.2 Analysis
First, CO 2 emissions were divided into production-based and consumption-based.
The former were considered to be CO 2 emissions from production for which
Industry
Final Use
Total
Industry
Intermediate Use
Domestic
Final Use
Exports
Total
Output
Imports
Value Added
Total Output
Fig. 16.5 Structure of national input-output table. (Source: Timmer 2012, p. 63)
16 An Empirical Analysis of International Carbon Transfer
295