

16.3 Methodology
16.3.1 World Input-Output Database
The World Input-Output Database (WIOD) was developed to analyze the effects of
globalization on trade patterns, environmental pressures, and socioeconomic development across a wide set of countries. The database covers 27 countries of the
European Union and 13 other major countries over the period from 1995 to 2009
(Timmer 2012, p. 3). The structure of a national input-output table (IOT) is shown in
Fig. 16.5. An important component of the IOT is that total output by domestic
industry is equal to the use of output from domestic industry, such that all flows in
the economic system are accounted for (Timmer 2012, p. 4).
The world input-output table (WIOT) is an extension of the WIOD concept.
7
Each product is explicitly tracked in the WIOT. For example, for a country, flows of
0%
20%
40%
60%
80%
100%
2009
2012
2015
2016
China
India
Japan
Korea
Taiwan
ASEAN
Others
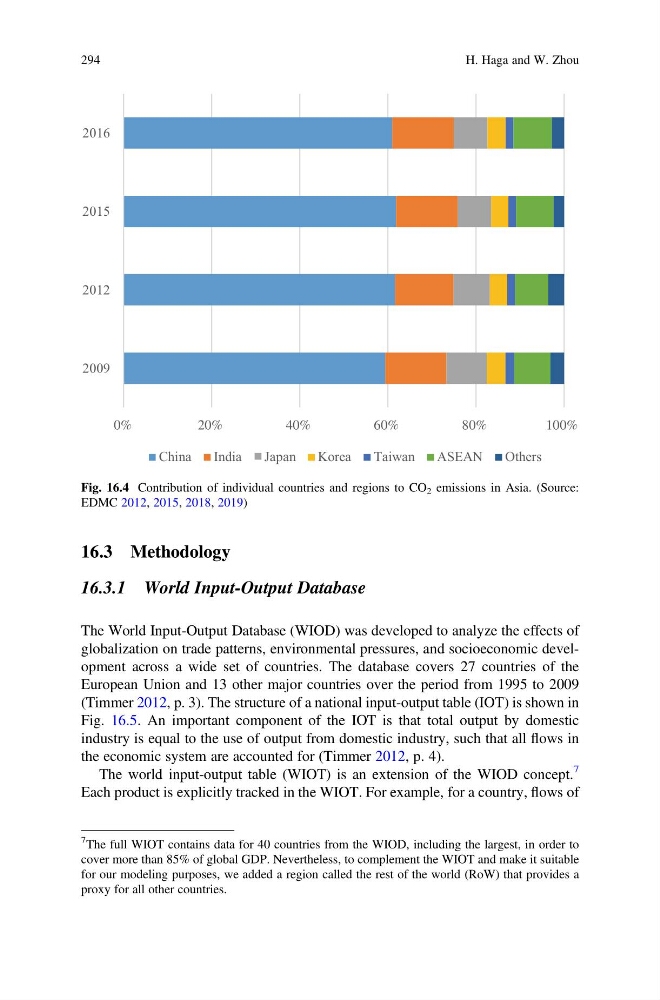
Fig. 16.4 Contribution of individual countries and regions to CO 2 emissions in Asia. (Source:
EDMC 2012, 2015, 2018, 2019)
7 The full WIOT contains data for 40 countries from the WIOD, including the largest, in order to
cover more than 85% of global GDP. Nevertheless, to complement the WIOT and make it suitable
for our modeling purposes, we added a region called the rest of the world (RoW) that provides a
proxy for all other countries.
294
H. Haga and W. Zhou
16.3.1 World Input-Output Database
The World Input-Output Database (WIOD) was developed to analyze the effects of
globalization on trade patterns, environmental pressures, and socioeconomic development across a wide set of countries. The database covers 27 countries of the
European Union and 13 other major countries over the period from 1995 to 2009
(Timmer 2012, p. 3). The structure of a national input-output table (IOT) is shown in
Fig. 16.5. An important component of the IOT is that total output by domestic
industry is equal to the use of output from domestic industry, such that all flows in
the economic system are accounted for (Timmer 2012, p. 4).
The world input-output table (WIOT) is an extension of the WIOD concept.
7
Each product is explicitly tracked in the WIOT. For example, for a country, flows of
0%
20%
40%
60%
80%
100%
2009
2012
2015
2016
China
India
Japan
Korea
Taiwan
ASEAN
Others
Fig. 16.4 Contribution of individual countries and regions to CO 2 emissions in Asia. (Source:
EDMC 2012, 2015, 2018, 2019)
7 The full WIOT contains data for 40 countries from the WIOD, including the largest, in order to
cover more than 85% of global GDP. Nevertheless, to complement the WIOT and make it suitable
for our modeling purposes, we added a region called the rest of the world (RoW) that provides a
proxy for all other countries.
294
H. Haga and W. Zhou