

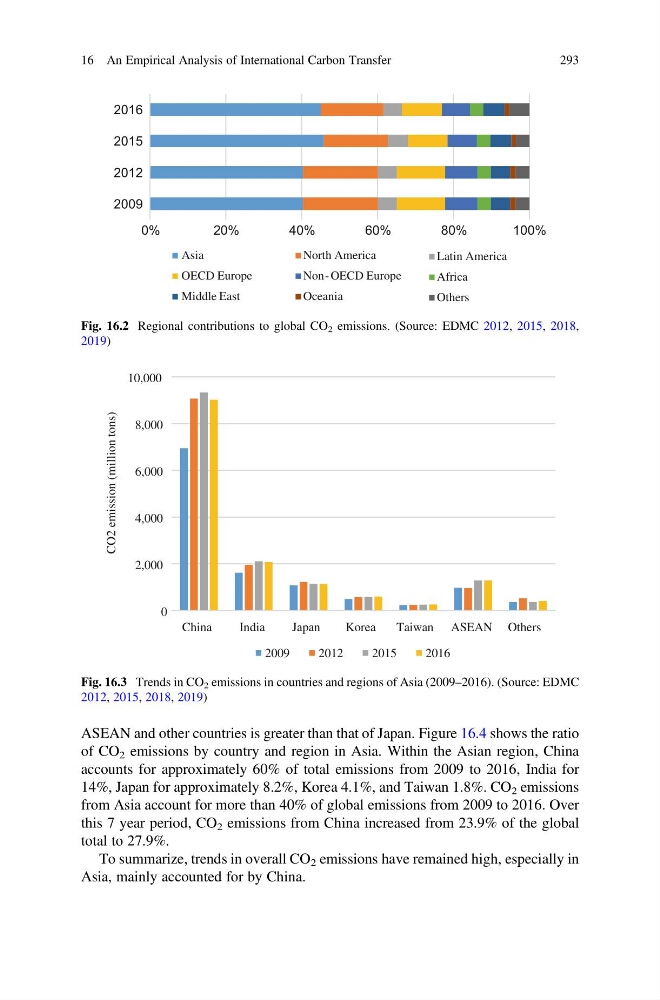
ASEAN and other countries is greater than that of Japan. Figure 16.4 shows the ratio
of CO 2 emissions by country and region in Asia. Within the Asian region, China
accounts for approximately 60% of total emissions from 2009 to 2016, India for
14%, Japan for approximately 8.2%, Korea 4.1%, and Taiwan 1.8%. CO 2 emissions
from Asia account for more than 40% of global emissions from 2009 to 2016. Over
this 7 year period, CO 2 emissions from China increased from 23.9% of the global
total to 27.9%.
To summarize, trends in overall CO 2 emissions have remained high, especially in
Asia, mainly accounted for by China.
0%
20%
40%
60%
80%
100%
2009
2012
2015
2016
Asia
North America
Latin America
OECD Europe
Non- OECD Europe
Africa
Middle East
Oceania
Others
Fig. 16.2 Regional contributions to global CO 2 emissions. (Source: EDMC 2012, 2015, 2018,
2019)
0
2,000
4,000
6,000
8,000
10,000
China
India
Japan
Korea
Taiwan ASEAN Others
CO2 emission (million tons)
2009
2012
2015
2016
Fig. 16.3 Trends in CO 2 emissions in countries and regions of Asia (2009–2016). (Source: EDMC
2012, 2015, 2018, 2019)
16 An Empirical Analysis of International Carbon Transfer
293
of CO 2 emissions by country and region in Asia. Within the Asian region, China
accounts for approximately 60% of total emissions from 2009 to 2016, India for
14%, Japan for approximately 8.2%, Korea 4.1%, and Taiwan 1.8%. CO 2 emissions
from Asia account for more than 40% of global emissions from 2009 to 2016. Over
this 7 year period, CO 2 emissions from China increased from 23.9% of the global
total to 27.9%.
To summarize, trends in overall CO 2 emissions have remained high, especially in
Asia, mainly accounted for by China.
0%
20%
40%
60%
80%
100%
2009
2012
2015
2016
Asia
North America
Latin America
OECD Europe
Non- OECD Europe
Africa
Middle East
Oceania
Others
Fig. 16.2 Regional contributions to global CO 2 emissions. (Source: EDMC 2012, 2015, 2018,
2019)
0
2,000
4,000
6,000
8,000
10,000
China
India
Japan
Korea
Taiwan ASEAN Others
CO2 emission (million tons)
2009
2012
2015
2016
Fig. 16.3 Trends in CO 2 emissions in countries and regions of Asia (2009–2016). (Source: EDMC
2012, 2015, 2018, 2019)
16 An Empirical Analysis of International Carbon Transfer
293