

the quantitative analysis of CO 2 emissions induced across different areas. The results
are discussed in Sects. 16.5 and 16.6 concludes.
16.2 Global Trends in CO 2 Emissions
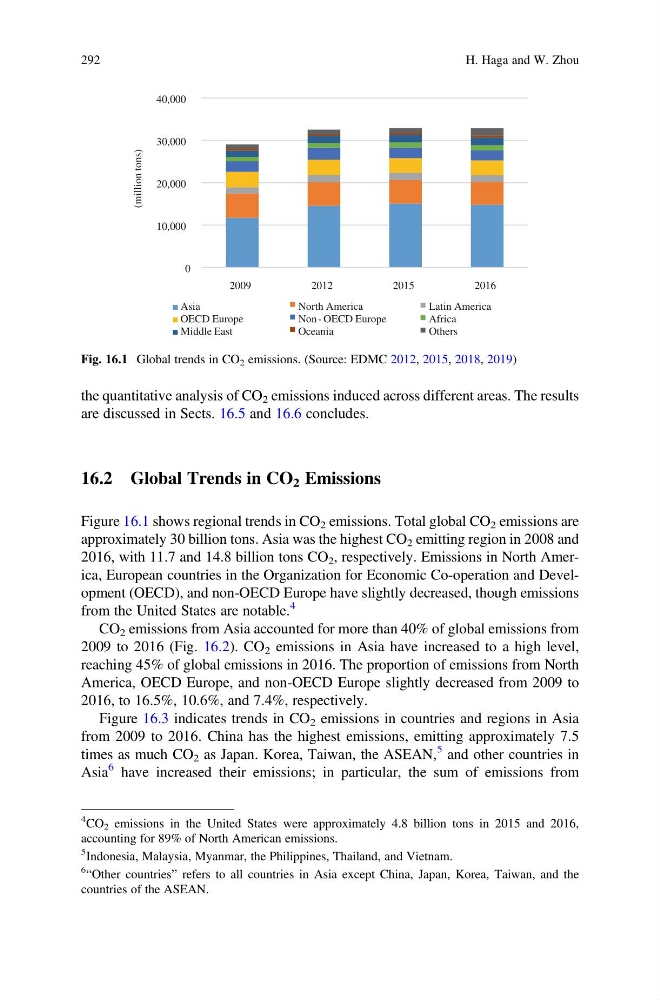
Figure 16.1 shows regional trends in CO 2 emissions. Total global CO 2 emissions are
approximately 30 billion tons. Asia was the highest CO 2 emitting region in 2008 and
2016, with 11.7 and 14.8 billion tons CO 2 , respectively. Emissions in North America, European countries in the Organization for Economic Co-operation and Development (OECD), and non-OECD Europe have slightly decreased, though emissions
from the United States are notable.
4
CO 2 emissions from Asia accounted for more than 40% of global emissions from
2009 to 2016 (Fig. 16.2). CO 2 emissions in Asia have increased to a high level,
reaching 45% of global emissions in 2016. The proportion of emissions from North
America, OECD Europe, and non-OECD Europe slightly decreased from 2009 to
2016, to 16.5%, 10.6%, and 7.4%, respectively.
Figure 16.3 indicates trends in CO 2 emissions in countries and regions in Asia
from 2009 to 2016. China has the highest emissions, emitting approximately 7.5
times as much CO 2 as Japan. Korea, Taiwan, the ASEAN,
5 and other countries in
Asia
6 have increased their emissions; in particular, the sum of emissions from
0
10,000
20,000
30,000
40,000
2009
2012
2015
2016
(million tons)
Asia
North America
Latin America
OECD Europe
Non - OECD Europe
Africa
Middle East
Oceania
Others
Fig. 16.1 Global trends in CO 2 emissions. (Source: EDMC 2012, 2015, 2018, 2019)
4 CO 2 emissions in the United States were approximately 4.8 billion tons in 2015 and 2016,
accounting for 89% of North American emissions.
5 Indonesia, Malaysia, Myanmar, the Philippines, Thailand, and Vietnam.
6 “Other countries” refers to all countries in Asia except China, Japan, Korea, Taiwan, and the
countries of the ASEAN.
292
H. Haga and W. Zhou
are discussed in Sects. 16.5 and 16.6 concludes.
16.2 Global Trends in CO 2 Emissions
Figure 16.1 shows regional trends in CO 2 emissions. Total global CO 2 emissions are
approximately 30 billion tons. Asia was the highest CO 2 emitting region in 2008 and
2016, with 11.7 and 14.8 billion tons CO 2 , respectively. Emissions in North America, European countries in the Organization for Economic Co-operation and Development (OECD), and non-OECD Europe have slightly decreased, though emissions
from the United States are notable.
4
CO 2 emissions from Asia accounted for more than 40% of global emissions from
2009 to 2016 (Fig. 16.2). CO 2 emissions in Asia have increased to a high level,
reaching 45% of global emissions in 2016. The proportion of emissions from North
America, OECD Europe, and non-OECD Europe slightly decreased from 2009 to
2016, to 16.5%, 10.6%, and 7.4%, respectively.
Figure 16.3 indicates trends in CO 2 emissions in countries and regions in Asia
from 2009 to 2016. China has the highest emissions, emitting approximately 7.5
times as much CO 2 as Japan. Korea, Taiwan, the ASEAN,
5 and other countries in
Asia
6 have increased their emissions; in particular, the sum of emissions from
0
10,000
20,000
30,000
40,000
2009
2012
2015
2016
(million tons)
Asia
North America
Latin America
OECD Europe
Non - OECD Europe
Africa
Middle East
Oceania
Others
Fig. 16.1 Global trends in CO 2 emissions. (Source: EDMC 2012, 2015, 2018, 2019)
4 CO 2 emissions in the United States were approximately 4.8 billion tons in 2015 and 2016,
accounting for 89% of North American emissions.
5 Indonesia, Malaysia, Myanmar, the Philippines, Thailand, and Vietnam.
6 “Other countries” refers to all countries in Asia except China, Japan, Korea, Taiwan, and the
countries of the ASEAN.
292
H. Haga and W. Zhou