

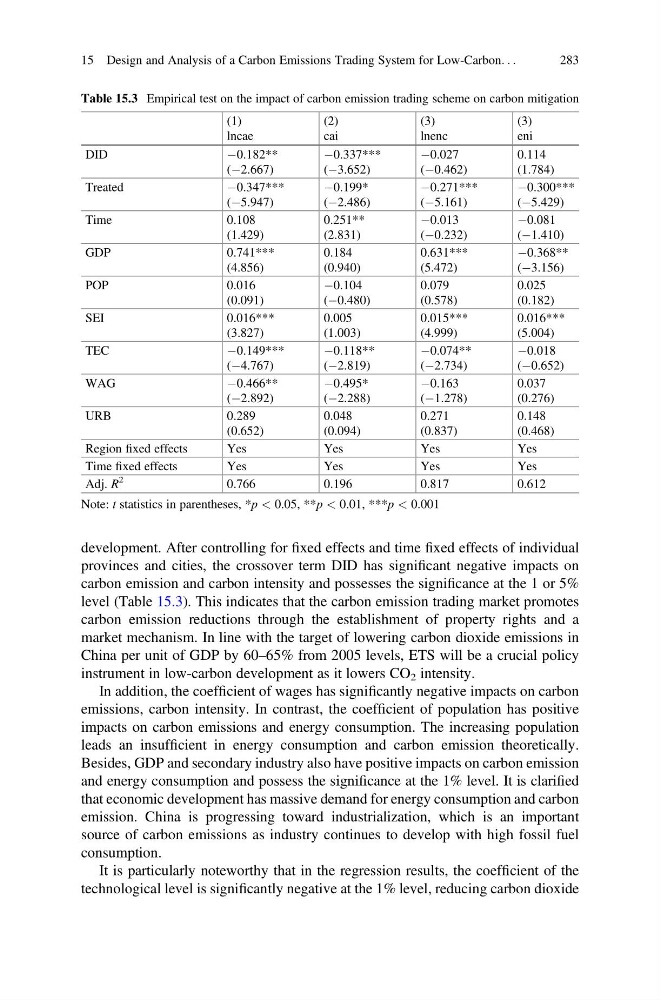
development. After controlling for fixed effects and time fixed effects of individual
provinces and cities, the crossover term DID has significant negative impacts on
carbon emission and carbon intensity and possesses the significance at the 1 or 5%
level (Table 15.3). This indicates that the carbon emission trading market promotes
carbon emission reductions through the establishment of property rights and a
market mechanism. In line with the target of lowering carbon dioxide emissions in
China per unit of GDP by 60–65% from 2005 levels, ETS will be a crucial policy
instrument in low-carbon development as it lowers CO 2 intensity.
In addition, the coefficient of wages has significantly negative impacts on carbon
emissions, carbon intensity. In contrast, the coefficient of population has positive
impacts on carbon emissions and energy consumption. The increasing population
leads an insufficient in energy consumption and carbon emission theoretically.
Besides, GDP and secondary industry also have positive impacts on carbon emission
and energy consumption and possess the significance at the 1% level. It is clarified
that economic development has massive demand for energy consumption and carbon
emission. China is progressing toward industrialization, which is an important
source of carbon emissions as industry continues to develop with high fossil fuel
consumption.
It is particularly noteworthy that in the regression results, the coefficient of the
technological level is significantly negative at the 1% level, reducing carbon dioxide
Table 15.3 Empirical test on the impact of carbon emission trading scheme on carbon mitigation
(1)
lncae
(2)
cai
(3)
lnenc
(3)
eni
DID
À0.182**
(À2.667)
À0.337***
(À3.652)
À0.027
(À0.462)
0.114
(1.784)
Treated
À0.347***
(À5.947)
À0.199*
(À2.486)
À0.271***
(À5.161)
À0.300***
(À5.429)
Time
0.108
(1.429)
0.251**
(2.831)
À0.013
(À0.232)
À0.081
(À1.410)
GDP
0.741***
(4.856)
0.184
(0.940)
0.631***
(5.472)
À0.368**
(À3.156)
POP
0.016
(0.091)
À0.104
(À0.480)
0.079
(0.578)
0.025
(0.182)
SEI
0.016***
(3.827)
0.005
(1.003)
0.015***
(4.999)
0.016***
(5.004)
TEC
À0.149***
(À4.767)
À0.118**
(À2.819)
À0.074**
(À2.734)
À0.018
(À0.652)
WAG
À0.466**
(À2.892)
À0.495*
(À2.288)
À0.163
(À1.278)
0.037
(0.276)
URB
0.289
(0.652)
0.048
(0.094)
0.271
(0.837)
0.148
(0.468)
Region fixed effects
Yes
Yes
Yes
Yes
Time fixed effects
Yes
Yes
Yes
Yes
Adj. R
2
0.766
0.196
0.817
0.612
Note: t statistics in parentheses, *p < 0.05, **p < 0.01, ***p < 0.001
15 Design and Analysis of a Carbon Emissions Trading System for Low-Carbon. . .
283
provinces and cities, the crossover term DID has significant negative impacts on
carbon emission and carbon intensity and possesses the significance at the 1 or 5%
level (Table 15.3). This indicates that the carbon emission trading market promotes
carbon emission reductions through the establishment of property rights and a
market mechanism. In line with the target of lowering carbon dioxide emissions in
China per unit of GDP by 60–65% from 2005 levels, ETS will be a crucial policy
instrument in low-carbon development as it lowers CO 2 intensity.
In addition, the coefficient of wages has significantly negative impacts on carbon
emissions, carbon intensity. In contrast, the coefficient of population has positive
impacts on carbon emissions and energy consumption. The increasing population
leads an insufficient in energy consumption and carbon emission theoretically.
Besides, GDP and secondary industry also have positive impacts on carbon emission
and energy consumption and possess the significance at the 1% level. It is clarified
that economic development has massive demand for energy consumption and carbon
emission. China is progressing toward industrialization, which is an important
source of carbon emissions as industry continues to develop with high fossil fuel
consumption.
It is particularly noteworthy that in the regression results, the coefficient of the
technological level is significantly negative at the 1% level, reducing carbon dioxide
Table 15.3 Empirical test on the impact of carbon emission trading scheme on carbon mitigation
(1)
lncae
(2)
cai
(3)
lnenc
(3)
eni
DID
À0.182**
(À2.667)
À0.337***
(À3.652)
À0.027
(À0.462)
0.114
(1.784)
Treated
À0.347***
(À5.947)
À0.199*
(À2.486)
À0.271***
(À5.161)
À0.300***
(À5.429)
Time
0.108
(1.429)
0.251**
(2.831)
À0.013
(À0.232)
À0.081
(À1.410)
GDP
0.741***
(4.856)
0.184
(0.940)
0.631***
(5.472)
À0.368**
(À3.156)
POP
0.016
(0.091)
À0.104
(À0.480)
0.079
(0.578)
0.025
(0.182)
SEI
0.016***
(3.827)
0.005
(1.003)
0.015***
(4.999)
0.016***
(5.004)
TEC
À0.149***
(À4.767)
À0.118**
(À2.819)
À0.074**
(À2.734)
À0.018
(À0.652)
WAG
À0.466**
(À2.892)
À0.495*
(À2.288)
À0.163
(À1.278)
0.037
(0.276)
URB
0.289
(0.652)
0.048
(0.094)
0.271
(0.837)
0.148
(0.468)
Region fixed effects
Yes
Yes
Yes
Yes
Time fixed effects
Yes
Yes
Yes
Yes
Adj. R
2
0.766
0.196
0.817
0.612
Note: t statistics in parentheses, *p < 0.05, **p < 0.01, ***p < 0.001
15 Design and Analysis of a Carbon Emissions Trading System for Low-Carbon. . .
283