

Table 15.1. By summing the emissions from different energy types, the total CO 2
emissions for a single province from 2008 to 2017 are given by Eq. (15.9).
CE ¼
X
CE i
ð15:9Þ
Data on population, GDP, added value of secondary industry, R&D input, and
SO 2 emissions are collected from the China Statistical Yearbook (2009–2018). The
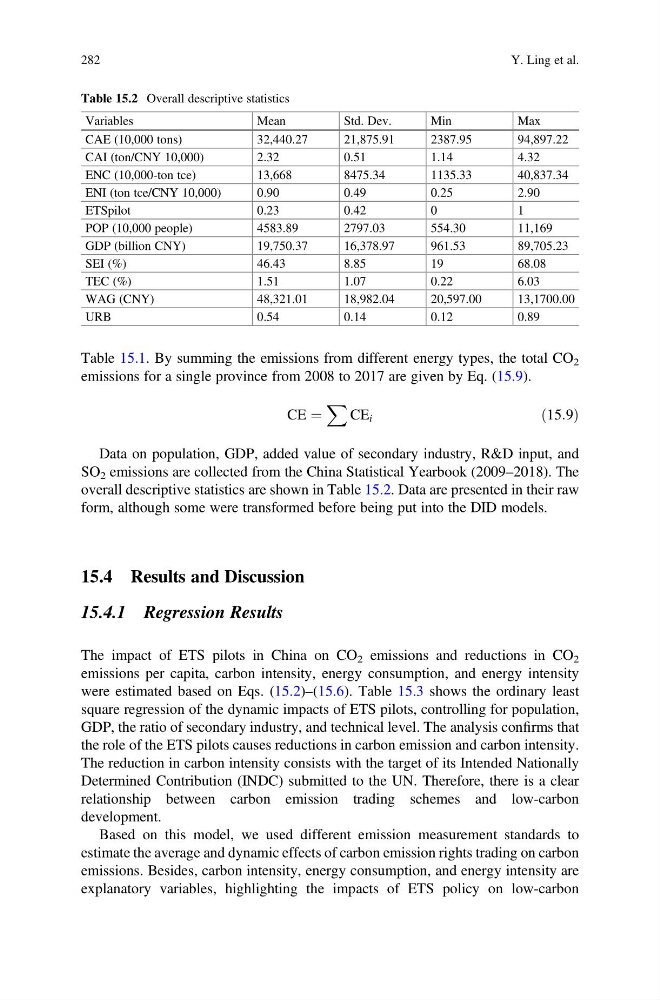
overall descriptive statistics are shown in Table 15.2. Data are presented in their raw
form, although some were transformed before being put into the DID models.
15.4 Results and Discussion
15.4.1 Regression Results
The impact of ETS pilots in China on CO 2 emissions and reductions in CO 2
emissions per capita, carbon intensity, energy consumption, and energy intensity
were estimated based on Eqs. (15.2)–(15.6). Table 15.3 shows the ordinary least
square regression of the dynamic impacts of ETS pilots, controlling for population,
GDP, the ratio of secondary industry, and technical level. The analysis confirms that
the role of the ETS pilots causes reductions in carbon emission and carbon intensity.
The reduction in carbon intensity consists with the target of its Intended Nationally
Determined Contribution (INDC) submitted to the UN. Therefore, there is a clear
relationship between carbon emission trading schemes and low-carbon
development.
Based on this model, we used different emission measurement standards to
estimate the average and dynamic effects of carbon emission rights trading on carbon
emissions. Besides, carbon intensity, energy consumption, and energy intensity are
explanatory variables, highlighting the impacts of ETS policy on low-carbon
Table 15.2 Overall descriptive statistics
Variables
Mean
Std. Dev.
Min
Max
CAE (10,000 tons)
32,440.27
21,875.91
2387.95
94,897.22
CAI (ton/CNY 10,000)
2.32
0.51
1.14
4.32
ENC (10,000-ton tce)
13,668
8475.34
1135.33
40,837.34
ENI (ton tce/CNY 10,000)
0.90
0.49
0.25
2.90
ETSpilot
0.23
0.42
0
1
POP (10,000 people)
4583.89
2797.03
554.30
11,169
GDP (billion CNY)
19,750.37
16,378.97
961.53
89,705.23
SEI (%)
46.43
8.85
19
68.08
TEC (%)
1.51
1.07
0.22
6.03
WAG (CNY)
48,321.01
18,982.04
20,597.00
13,1700.00
URB
0.54
0.14
0.12
0.89
282
Y. Ling et al.
emissions for a single province from 2008 to 2017 are given by Eq. (15.9).
CE ¼
X
CE i
ð15:9Þ
Data on population, GDP, added value of secondary industry, R&D input, and
SO 2 emissions are collected from the China Statistical Yearbook (2009–2018). The
overall descriptive statistics are shown in Table 15.2. Data are presented in their raw
form, although some were transformed before being put into the DID models.
15.4 Results and Discussion
15.4.1 Regression Results
The impact of ETS pilots in China on CO 2 emissions and reductions in CO 2
emissions per capita, carbon intensity, energy consumption, and energy intensity
were estimated based on Eqs. (15.2)–(15.6). Table 15.3 shows the ordinary least
square regression of the dynamic impacts of ETS pilots, controlling for population,
GDP, the ratio of secondary industry, and technical level. The analysis confirms that
the role of the ETS pilots causes reductions in carbon emission and carbon intensity.
The reduction in carbon intensity consists with the target of its Intended Nationally
Determined Contribution (INDC) submitted to the UN. Therefore, there is a clear
relationship between carbon emission trading schemes and low-carbon
development.
Based on this model, we used different emission measurement standards to
estimate the average and dynamic effects of carbon emission rights trading on carbon
emissions. Besides, carbon intensity, energy consumption, and energy intensity are
explanatory variables, highlighting the impacts of ETS policy on low-carbon
Table 15.2 Overall descriptive statistics
Variables
Mean
Std. Dev.
Min
Max
CAE (10,000 tons)
32,440.27
21,875.91
2387.95
94,897.22
CAI (ton/CNY 10,000)
2.32
0.51
1.14
4.32
ENC (10,000-ton tce)
13,668
8475.34
1135.33
40,837.34
ENI (ton tce/CNY 10,000)
0.90
0.49
0.25
2.90
ETSpilot
0.23
0.42
0
1
POP (10,000 people)
4583.89
2797.03
554.30
11,169
GDP (billion CNY)
19,750.37
16,378.97
961.53
89,705.23
SEI (%)
46.43
8.85
19
68.08
TEC (%)
1.51
1.07
0.22
6.03
WAG (CNY)
48,321.01
18,982.04
20,597.00
13,1700.00
URB
0.54
0.14
0.12
0.89
282
Y. Ling et al.