

represents the estimator of difference-in-differences and measures the impacts of
pilot ETS on low-carbon development. γ t represents time fixed effects, μ i represents
region fixed effects, and ε it represents random disturbances. Reductions in CO 2
emissions, CO 2 emissions per capita, carbon intensity, energy consumption, and
energy intensity are estimated as dependent variables to comprehensively assess
carbon emissions reduction.
Control variables are included to ensure the model is robust. Variables of
industrial structure, technology, R&D, population, GDP per capita, and energy
intensity are often selected in studies (Zhang et al. 2017a, b and Wang et al.
2019). We consider population and the scale of the economy to be the main factors
affecting carbon emissions. Industrial structure, especially secondary industry, has a
significant impact on production. Regional technological progress is also related to
the effectiveness of emission reductions. Due to incomplete data on disposable
income, we use residents’ wages to measure the effect of income levels on carbon
emissions. As urbanization has a significant positive effect on carbon emissions in
China, the proportion of urban population to the total population at each year end is
used to measure the role of urbanization. In summary, we use GDP, population,
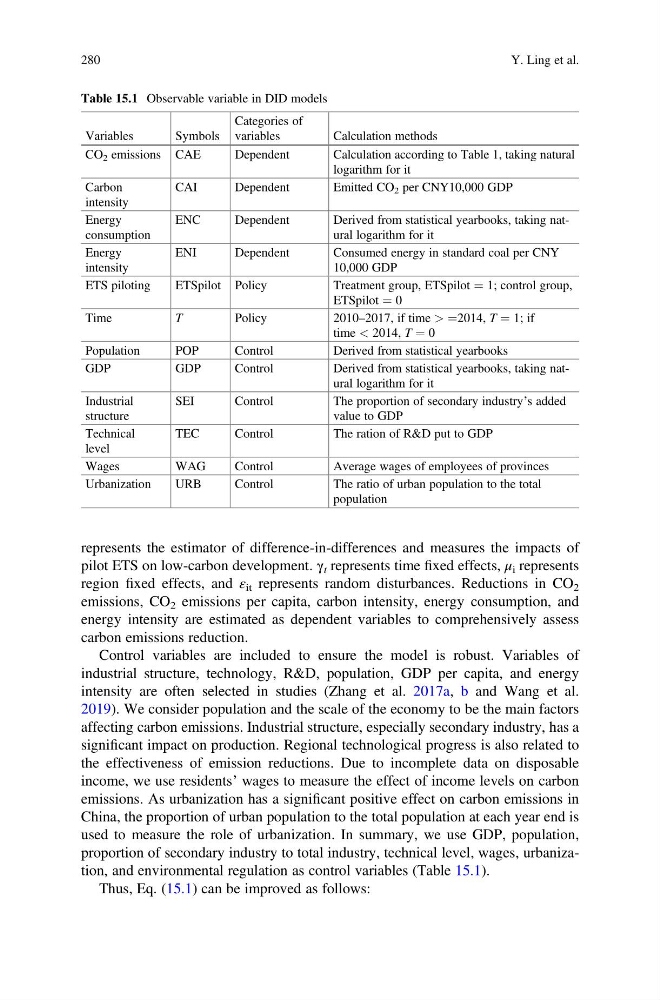
proportion of secondary industry to total industry, technical level, wages, urbanization, and environmental regulation as control variables (Table 15.1).
Thus, Eq. (15.1) can be improved as follows:
Table 15.1 Observable variable in DID models
Variables
Symbols
Categories of
variables
Calculation methods
CO 2 emissions CAE
Dependent
Calculation according to Table 1, taking natural
logarithm for it
Carbon
intensity
CAI
Dependent
Emitted CO 2 per CNY10,000 GDP
Energy
consumption
ENC
Dependent
Derived from statistical yearbooks, taking natural logarithm for it
Energy
intensity
ENI
Dependent
Consumed energy in standard coal per CNY
10,000 GDP
ETS piloting
ETSpilot Policy
Treatment group, ETSpilot ¼ 1; control group,
ETSpilot ¼ 0
Time
T
Policy
2010–2017, if time > ¼2014, T ¼ 1; if
time < 2014, T ¼ 0
Population
POP
Control
Derived from statistical yearbooks
GDP
GDP
Control
Derived from statistical yearbooks, taking natural logarithm for it
Industrial
structure
SEI
Control
The proportion of secondary industry’s added
value to GDP
Technical
level
TEC
Control
The ration of R&D put to GDP
Wages
WAG
Control
Average wages of employees of provinces
Urbanization
URB
Control
The ratio of urban population to the total
population
280
Y. Ling et al.
pilot ETS on low-carbon development. γ t represents time fixed effects, μ i represents
region fixed effects, and ε it represents random disturbances. Reductions in CO 2
emissions, CO 2 emissions per capita, carbon intensity, energy consumption, and
energy intensity are estimated as dependent variables to comprehensively assess
carbon emissions reduction.
Control variables are included to ensure the model is robust. Variables of
industrial structure, technology, R&D, population, GDP per capita, and energy
intensity are often selected in studies (Zhang et al. 2017a, b and Wang et al.
2019). We consider population and the scale of the economy to be the main factors
affecting carbon emissions. Industrial structure, especially secondary industry, has a
significant impact on production. Regional technological progress is also related to
the effectiveness of emission reductions. Due to incomplete data on disposable
income, we use residents’ wages to measure the effect of income levels on carbon
emissions. As urbanization has a significant positive effect on carbon emissions in
China, the proportion of urban population to the total population at each year end is
used to measure the role of urbanization. In summary, we use GDP, population,
proportion of secondary industry to total industry, technical level, wages, urbanization, and environmental regulation as control variables (Table 15.1).
Thus, Eq. (15.1) can be improved as follows:
Table 15.1 Observable variable in DID models
Variables
Symbols
Categories of
variables
Calculation methods
CO 2 emissions CAE
Dependent
Calculation according to Table 1, taking natural
logarithm for it
Carbon
intensity
CAI
Dependent
Emitted CO 2 per CNY10,000 GDP
Energy
consumption
ENC
Dependent
Derived from statistical yearbooks, taking natural logarithm for it
Energy
intensity
ENI
Dependent
Consumed energy in standard coal per CNY
10,000 GDP
ETS piloting
ETSpilot Policy
Treatment group, ETSpilot ¼ 1; control group,
ETSpilot ¼ 0
Time
T
Policy
2010–2017, if time > ¼2014, T ¼ 1; if
time < 2014, T ¼ 0
Population
POP
Control
Derived from statistical yearbooks
GDP
GDP
Control
Derived from statistical yearbooks, taking natural logarithm for it
Industrial
structure
SEI
Control
The proportion of secondary industry’s added
value to GDP
Technical
level
TEC
Control
The ration of R&D put to GDP
Wages
WAG
Control
Average wages of employees of provinces
Urbanization
URB
Control
The ratio of urban population to the total
population
280
Y. Ling et al.