

during June and July. To ensure participants can comply with annual targets,
Beijing, Tianjin, Shanghai, and Hubei have all extended their compliance periods
at least once, leading to a high concentration of trading before and after June. Since
liquidity directly affects prices, the price decreases due to this concentration of
trading, and there is a higher risk to market security. It follows that the higher the
historical volatility is, the riskier the security is. The current pilot markets tend to
trade within a short term, so the liquidity of each pilot market remains low.
15.3 Methodology
15.3.1 Research Design
The market performance analysis in Sect. 15.2 shows that the ETS pilots have
different scheme designs due to differences in developmental stages and emission
situations. However, they share some common characteristics, such as “seizing large
enterprises and releasing medium and small ones.” Overall, pilot ETS in China can
be considered a quasi-experiment. Therefore, we take Beijing, Tianjin, Shanghai,
Chongqing, Guangdong (including Shenzhen), Hubei, and Fujian as the treatment
group and the remaining 24 provinces of China (excluding Tibet, Hong Kong,
Macao, and Taiwan) as the control group. We defined the treatment period as
2013–2017. The impact of the pilot ETS can be analyzed by comparing changes
in carbon emissions, carbon intensity, energy consumption, and energy intensity
between the treatment and control groups before and after the treatment period.
15.3.2 Methodology
15.3.2.1 Difference-in-Difference Model
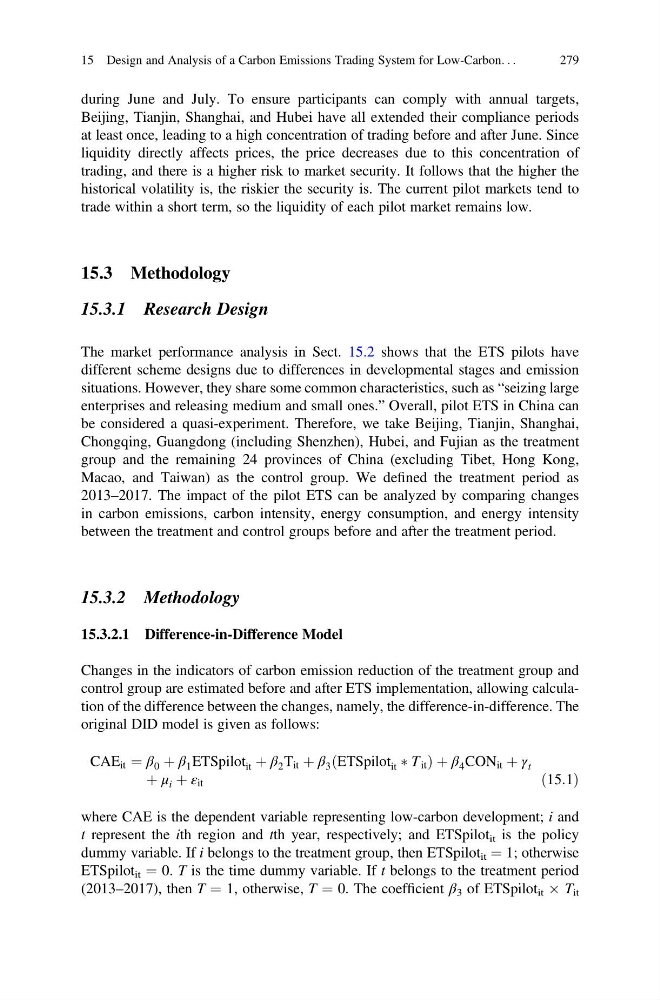
Changes in the indicators of carbon emission reduction of the treatment group and
control group are estimated before and after ETS implementation, allowing calculation of the difference between the changes, namely, the difference-in-difference. The
original DID model is given as follows:
CAE it ¼ β 0 þ β 1 ETSpilot it þ β 2 T it þ β 3 ETSpilot it à T it
ð
Þ þ β 4 CON it þ γ t
þ μ i þ ε it
ð15:1Þ
where CAE is the dependent variable representing low-carbon development; i and
t represent the ith region and tth year, respectively; and ETSpilot it is the policy
dummy variable. If i belongs to the treatment group, then ETSpilot it ¼ 1; otherwise
ETSpilot it ¼ 0. T is the time dummy variable. If t belongs to the treatment period
(2013–2017), then T ¼ 1, otherwise, T ¼ 0. The coefficient β 3 of ETSpilot it  T it
15 Design and Analysis of a Carbon Emissions Trading System for Low-Carbon. . .
279
Beijing, Tianjin, Shanghai, and Hubei have all extended their compliance periods
at least once, leading to a high concentration of trading before and after June. Since
liquidity directly affects prices, the price decreases due to this concentration of
trading, and there is a higher risk to market security. It follows that the higher the
historical volatility is, the riskier the security is. The current pilot markets tend to
trade within a short term, so the liquidity of each pilot market remains low.
15.3 Methodology
15.3.1 Research Design
The market performance analysis in Sect. 15.2 shows that the ETS pilots have
different scheme designs due to differences in developmental stages and emission
situations. However, they share some common characteristics, such as “seizing large
enterprises and releasing medium and small ones.” Overall, pilot ETS in China can
be considered a quasi-experiment. Therefore, we take Beijing, Tianjin, Shanghai,
Chongqing, Guangdong (including Shenzhen), Hubei, and Fujian as the treatment
group and the remaining 24 provinces of China (excluding Tibet, Hong Kong,
Macao, and Taiwan) as the control group. We defined the treatment period as
2013–2017. The impact of the pilot ETS can be analyzed by comparing changes
in carbon emissions, carbon intensity, energy consumption, and energy intensity
between the treatment and control groups before and after the treatment period.
15.3.2 Methodology
15.3.2.1 Difference-in-Difference Model
Changes in the indicators of carbon emission reduction of the treatment group and
control group are estimated before and after ETS implementation, allowing calculation of the difference between the changes, namely, the difference-in-difference. The
original DID model is given as follows:
CAE it ¼ β 0 þ β 1 ETSpilot it þ β 2 T it þ β 3 ETSpilot it à T it
ð
Þ þ β 4 CON it þ γ t
þ μ i þ ε it
ð15:1Þ
where CAE is the dependent variable representing low-carbon development; i and
t represent the ith region and tth year, respectively; and ETSpilot it is the policy
dummy variable. If i belongs to the treatment group, then ETSpilot it ¼ 1; otherwise
ETSpilot it ¼ 0. T is the time dummy variable. If t belongs to the treatment period
(2013–2017), then T ¼ 1, otherwise, T ¼ 0. The coefficient β 3 of ETSpilot it  T it
15 Design and Analysis of a Carbon Emissions Trading System for Low-Carbon. . .
279