

place three times and that in Guangdong twice from 2014 to 2019. In 2016, trading
value in Shanghai was highest, despite Guangdong having a larger trading volume.
In contrast, because of small trading volumes, trading values in Chongqing and
Tianjin are low throughout the period. There is a dramatic increase in trading value
in the Beijing ETS from 2014 to 2019. The trading value of the Shenzhen ETS
peaked in 2016 before gradually decreasing. The Shanghai ETS reached its lowest
point in 2016, after which the trading value gradually increases.
The allowance price is vital for clarifying the relationship between trading
volume and value. After higher prices during the initial period, prices in each pilot
remained at relatively low levels (Fig. 15.3). Considering trends in allowance prices,
Beijing ETS is the only pilot that retained a stable price, showing a slight increase
from 2019. Shenzhen ETS allowance price decreased from the initial stage, from its
highest price of 122.97 CNY/ton in 2013 to its lowest price of 7.89 CNY/ton in
2019. Shanghai ETS experienced a slump in prices in 2016 when trading volume
increased, meaning that the trading value did not increase. Guangdong ETS experienced a similar trend, although prices after 2017 increased more slowly than those
in Shanghai. In Tianjin and Chongqing, prices slumped from the initial stage; prices
in Chongqing ETS in 2017 fell almost to zero. The huge increase in trading volume
in 2017 did not translate into a similar increase in trading value; the trading value
remained constant and almost fell to zero in 2018.
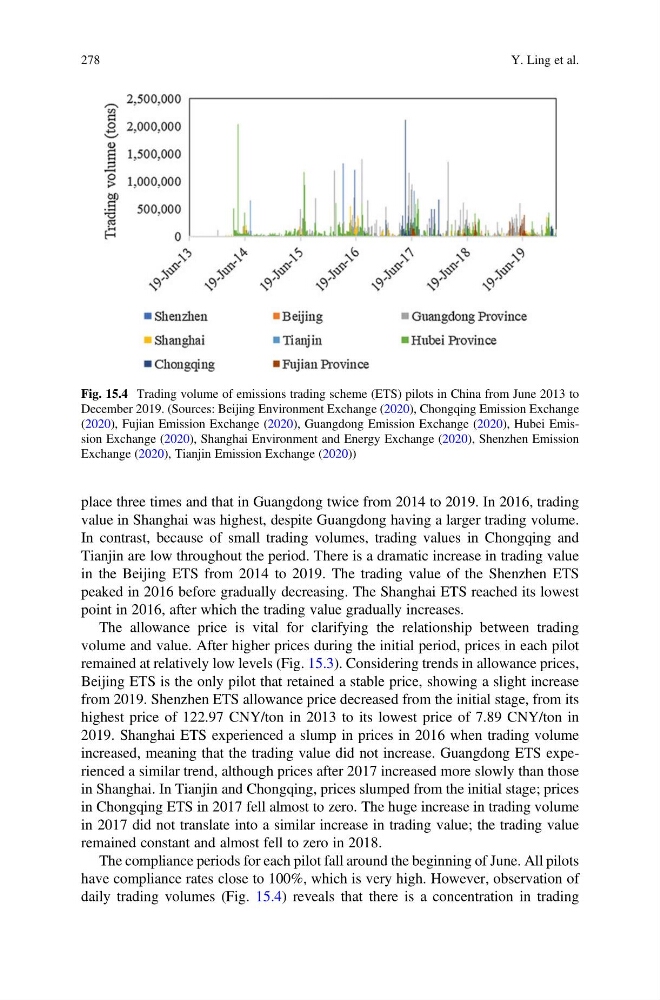
The compliance periods for each pilot fall around the beginning of June. All pilots
have compliance rates close to 100%, which is very high. However, observation of
daily trading volumes (Fig. 15.4) reveals that there is a concentration in trading
Fig. 15.4 Trading volume of emissions trading scheme (ETS) pilots in China from June 2013 to
December 2019. (Sources: Beijing Environment Exchange (2020), Chongqing Emission Exchange
(2020), Fujian Emission Exchange (2020), Guangdong Emission Exchange (2020), Hubei Emission Exchange (2020), Shanghai Environment and Energy Exchange (2020), Shenzhen Emission
Exchange (2020), Tianjin Emission Exchange (2020))
278
Y. Ling et al.
value in Shanghai was highest, despite Guangdong having a larger trading volume.
In contrast, because of small trading volumes, trading values in Chongqing and
Tianjin are low throughout the period. There is a dramatic increase in trading value
in the Beijing ETS from 2014 to 2019. The trading value of the Shenzhen ETS
peaked in 2016 before gradually decreasing. The Shanghai ETS reached its lowest
point in 2016, after which the trading value gradually increases.
The allowance price is vital for clarifying the relationship between trading
volume and value. After higher prices during the initial period, prices in each pilot
remained at relatively low levels (Fig. 15.3). Considering trends in allowance prices,
Beijing ETS is the only pilot that retained a stable price, showing a slight increase
from 2019. Shenzhen ETS allowance price decreased from the initial stage, from its
highest price of 122.97 CNY/ton in 2013 to its lowest price of 7.89 CNY/ton in
2019. Shanghai ETS experienced a slump in prices in 2016 when trading volume
increased, meaning that the trading value did not increase. Guangdong ETS experienced a similar trend, although prices after 2017 increased more slowly than those
in Shanghai. In Tianjin and Chongqing, prices slumped from the initial stage; prices
in Chongqing ETS in 2017 fell almost to zero. The huge increase in trading volume
in 2017 did not translate into a similar increase in trading value; the trading value
remained constant and almost fell to zero in 2018.
The compliance periods for each pilot fall around the beginning of June. All pilots
have compliance rates close to 100%, which is very high. However, observation of
daily trading volumes (Fig. 15.4) reveals that there is a concentration in trading
Fig. 15.4 Trading volume of emissions trading scheme (ETS) pilots in China from June 2013 to
December 2019. (Sources: Beijing Environment Exchange (2020), Chongqing Emission Exchange
(2020), Fujian Emission Exchange (2020), Guangdong Emission Exchange (2020), Hubei Emission Exchange (2020), Shanghai Environment and Energy Exchange (2020), Shenzhen Emission
Exchange (2020), Tianjin Emission Exchange (2020))
278
Y. Ling et al.